

13. Option 1: assess cell number in each well using a DNA based
stain such as CyQuant against a standard curve of known cell
numbers.
14. Option 2: Alternatively, Hoechst dye can be added to a final
concentration of 10 μg/mL for 10–60 min.
15. Image cells using an imaging system such as the InCell Analyzer 2200 high-content microscopy imaging system in the
488 nm channel. Images can be analysed using any software
capable of nuclear image segmentation analysis, e.g. Cell Profiler (Broad Institute; https://cellprofiler.org/citations/) can
be utilised to determine the number of Hoechst-positive
nuclei.
16. Normalise the results by adjusting for the actual cell number.
17. Analyse the data using Wave software (see Note 13).
3.4 Flow Cytometry
Profiling
for Mitochondrial
Antibodies
1. Use mitochondrial dyes CST Mitotracker Red FM and
CMXRos to quantitfy mitochondrial mass and membrane
potential, respectively. Concentrations for optimal staining
should be optimised using manufacture’s recommended
dilutions.
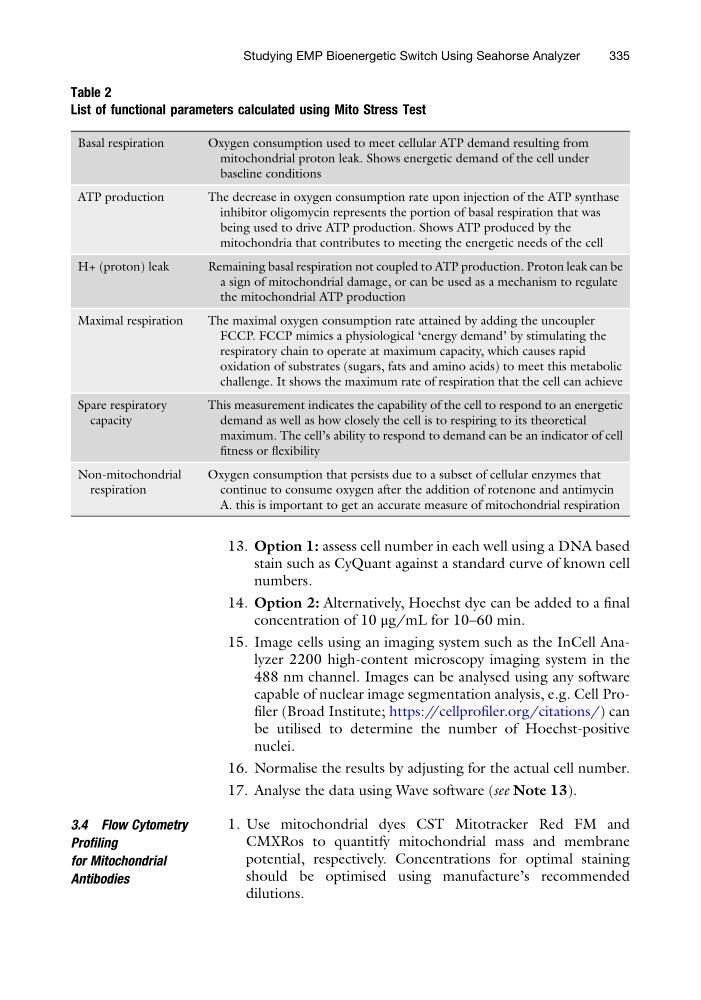
Table 2
List of functional parameters calculated using Mito Stress Test
Basal respiration
Oxygen consumption used to meet cellular ATP demand resulting from
mitochondrial proton leak. Shows energetic demand of the cell under
baseline conditions
ATP production
The decrease in oxygen consumption rate upon injection of the ATP synthase
inhibitor oligomycin represents the portion of basal respiration that was
being used to drive ATP production. Shows ATP produced by the
mitochondria that contributes to meeting the energetic needs of the cell
H+ (proton) leak
Remaining basal respiration not coupled to ATP production. Proton leak can be
a sign of mitochondrial damage, or can be used as a mechanism to regulate
the mitochondrial ATP production
Maximal respiration
The maximal oxygen consumption rate attained by adding the uncoupler
FCCP. FCCP mimics a physiological ‘energy demand’ by stimulating the
respiratory chain to operate at maximum capacity, which causes rapid
oxidation of substrates (sugars, fats and amino acids) to meet this metabolic
challenge. It shows the maximum rate of respiration that the cell can achieve
Spare respiratory
capacity
This measurement indicates the capability of the cell to respond to an energetic
demand as well as how closely the cell is to respiring to its theoretical
maximum. The cell’s ability to respond to demand can be an indicator of cell
fitness or flexibility
Non-mitochondrial
respiration
Oxygen consumption that persists due to a subset of cellular enzymes that
continue to consume oxygen after the addition of rotenone and antimycin
A. this is important to get an accurate measure of mitochondrial respiration
Studying EMP Bioenergetic Switch Using Seahorse Analyzer
335
stain such as CyQuant against a standard curve of known cell
numbers.
14. Option 2: Alternatively, Hoechst dye can be added to a final
concentration of 10 μg/mL for 10–60 min.
15. Image cells using an imaging system such as the InCell Analyzer 2200 high-content microscopy imaging system in the
488 nm channel. Images can be analysed using any software
capable of nuclear image segmentation analysis, e.g. Cell Profiler (Broad Institute; https://cellprofiler.org/citations/) can
be utilised to determine the number of Hoechst-positive
nuclei.
16. Normalise the results by adjusting for the actual cell number.
17. Analyse the data using Wave software (see Note 13).
3.4 Flow Cytometry
Profiling
for Mitochondrial
Antibodies
1. Use mitochondrial dyes CST Mitotracker Red FM and
CMXRos to quantitfy mitochondrial mass and membrane
potential, respectively. Concentrations for optimal staining
should be optimised using manufacture’s recommended
dilutions.
Table 2
List of functional parameters calculated using Mito Stress Test
Basal respiration
Oxygen consumption used to meet cellular ATP demand resulting from
mitochondrial proton leak. Shows energetic demand of the cell under
baseline conditions
ATP production
The decrease in oxygen consumption rate upon injection of the ATP synthase
inhibitor oligomycin represents the portion of basal respiration that was
being used to drive ATP production. Shows ATP produced by the
mitochondria that contributes to meeting the energetic needs of the cell
H+ (proton) leak
Remaining basal respiration not coupled to ATP production. Proton leak can be
a sign of mitochondrial damage, or can be used as a mechanism to regulate
the mitochondrial ATP production
Maximal respiration
The maximal oxygen consumption rate attained by adding the uncoupler
FCCP. FCCP mimics a physiological ‘energy demand’ by stimulating the
respiratory chain to operate at maximum capacity, which causes rapid
oxidation of substrates (sugars, fats and amino acids) to meet this metabolic
challenge. It shows the maximum rate of respiration that the cell can achieve
Spare respiratory
capacity
This measurement indicates the capability of the cell to respond to an energetic
demand as well as how closely the cell is to respiring to its theoretical
maximum. The cell’s ability to respond to demand can be an indicator of cell
fitness or flexibility
Non-mitochondrial
respiration
Oxygen consumption that persists due to a subset of cellular enzymes that
continue to consume oxygen after the addition of rotenone and antimycin
A. this is important to get an accurate measure of mitochondrial respiration
Studying EMP Bioenergetic Switch Using Seahorse Analyzer
335