

10. Run the experiment. The machine allows the cells a chance to
equilibrate before recommencing the assay. The default setup is
for the probe to mix the well contents for 3 min, measure O 2
and H
+ for 3 min for at least 3 cycles.
3.3.1 A Typical
Experiment Will Be
l
Mix for 3 min, measure for 3 min. Repeat for 3 measurements.
l
Inject port A.
l
Mix for 3 min, measure for 3 min. Repeat for 3 measurements.
l
Inject port B.
l
Mix for 3 min, measure for 3 min. Repeat for 3 measurements.
l
Inject port C.
l
Mix for 3 min, measure for 3 min. Repeat for 3 measurements.
l
End of assay.
The twelve measurements, represented as a line graph in Fig. 2
show the changes in bioenergetic profiles after the injection of
mitochondrial inhibitors (sourced with permission from Agilent
Technologies Pty Ltd) and explained further in Table 2 at the end
of the chapter (see Note 11).
Empty
port
FCCP
AnƟmycin A
+Rotenone
Oligomycin
A
B
C
D
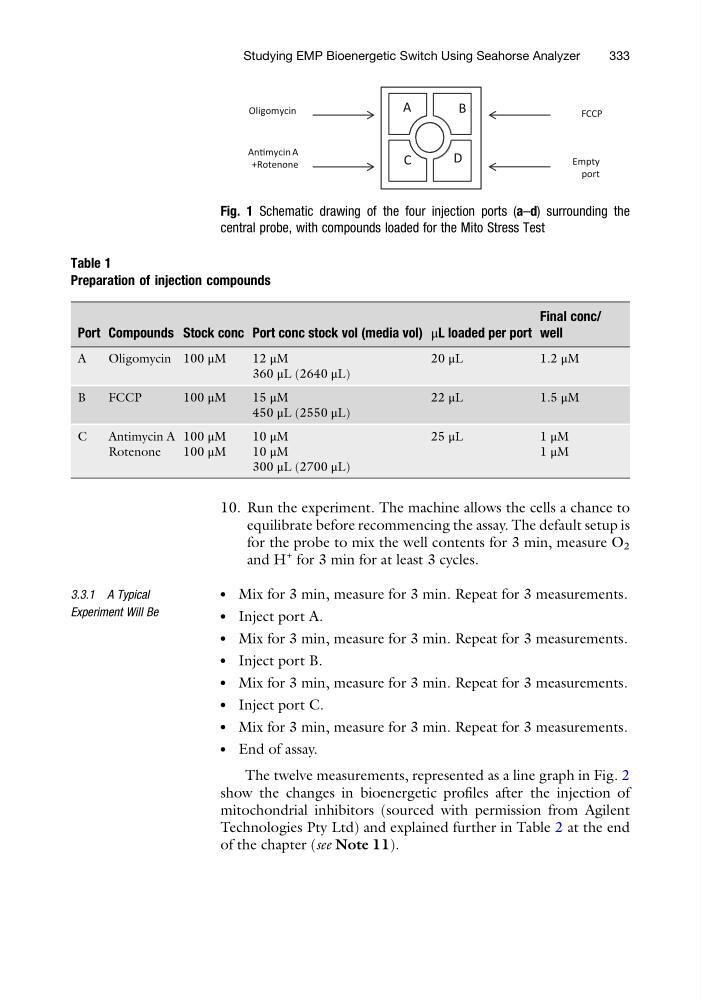
Fig. 1 Schematic drawing of the four injection ports (a–d) surrounding the
central probe, with compounds loaded for the Mito Stress Test
Table 1
Preparation of injection compounds
Port Compounds Stock conc Port conc stock vol (media vol) μL loaded per port
Final conc/
well
A
Oligomycin 100 μM
12μM
360 μL (2640 μL)
20 μL
1.2 μM
B
FCCP
100 μM
15μM
450 μL (2550 μL)
22 μL
1.5 μM
C
Antimycin A
Rotenone
100 μM
100 μM
10 μM
10 μM
300 μL (2700 μL)
25 μL
1 μM
1 μM
Studying EMP Bioenergetic Switch Using Seahorse Analyzer
333
equilibrate before recommencing the assay. The default setup is
for the probe to mix the well contents for 3 min, measure O 2
and H
+ for 3 min for at least 3 cycles.
3.3.1 A Typical
Experiment Will Be
l
Mix for 3 min, measure for 3 min. Repeat for 3 measurements.
l
Inject port A.
l
Mix for 3 min, measure for 3 min. Repeat for 3 measurements.
l
Inject port B.
l
Mix for 3 min, measure for 3 min. Repeat for 3 measurements.
l
Inject port C.
l
Mix for 3 min, measure for 3 min. Repeat for 3 measurements.
l
End of assay.
The twelve measurements, represented as a line graph in Fig. 2
show the changes in bioenergetic profiles after the injection of
mitochondrial inhibitors (sourced with permission from Agilent
Technologies Pty Ltd) and explained further in Table 2 at the end
of the chapter (see Note 11).
Empty
port
FCCP
AnƟmycin A
+Rotenone
Oligomycin
A
B
C
D
Fig. 1 Schematic drawing of the four injection ports (a–d) surrounding the
central probe, with compounds loaded for the Mito Stress Test
Table 1
Preparation of injection compounds
Port Compounds Stock conc Port conc stock vol (media vol) μL loaded per port
Final conc/
well
A
Oligomycin 100 μM
12μM
360 μL (2640 μL)
20 μL
1.2 μM
B
FCCP
100 μM
15μM
450 μL (2550 μL)
22 μL
1.5 μM
C
Antimycin A
Rotenone
100 μM
100 μM
10 μM
10 μM
300 μL (2700 μL)
25 μL
1 μM
1 μM
Studying EMP Bioenergetic Switch Using Seahorse Analyzer
333