

5. Specify spectral acquisition settings: 10 channels in the
473–561 nm bandwidth will capture both fluorophores. This
will generate a multichannel stack.
3.7 Image Analysis
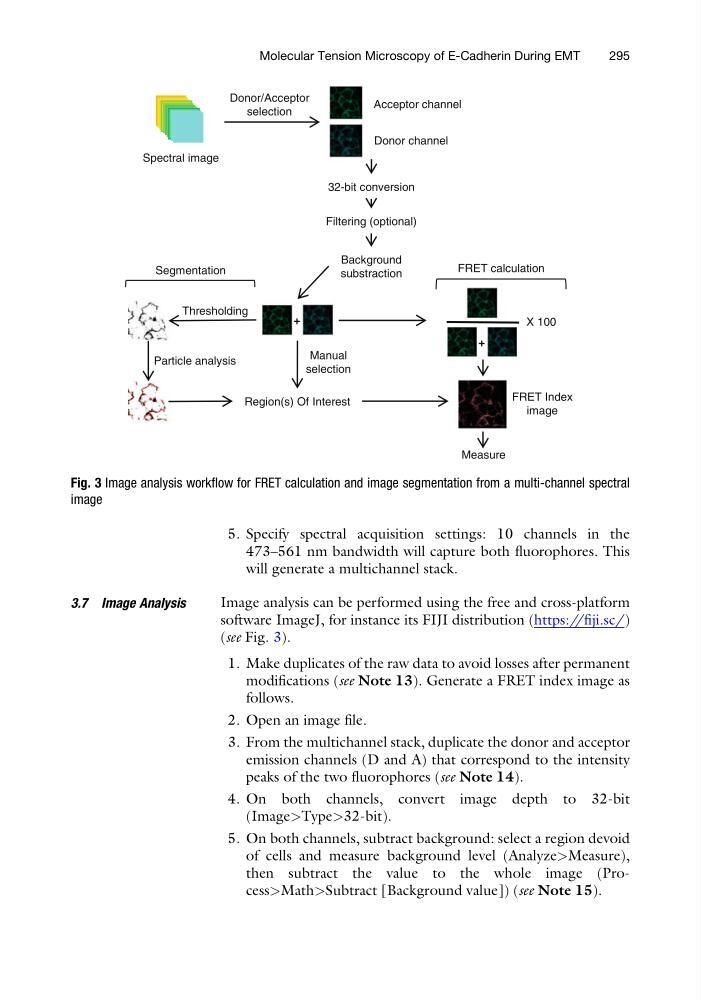
Image analysis can be performed using the free and cross-platform
software ImageJ, for instance its FIJI distribution (https://fiji.sc/)
(see Fig. 3).
1. Make duplicates of the raw data to avoid losses after permanent
modifications (see Note 13). Generate a FRET index image as
follows.
2. Open an image file.
3. From the multichannel stack, duplicate the donor and acceptor
emission channels (D and A) that correspond to the intensity
peaks of the two fluorophores (see Note 14).
4. On both channels, convert image depth to 32-bit
(Image>Type>32-bit).
5. On both channels, subtract background: select a region devoid
of cells and measure background level (Analyze>Measure),
then subtract the value to the whole image (Process>Math>Subtract [Background value]) (see Note 15).
Manual
selection
Region(s) Of Interest
Measure
Spectral image
Segmentation
FRET Index
image
Thresholding
Particle analysis
Acceptor channel
Donor channel
+
32-bit conversion
Background
substraction
Filtering (optional)
FRET calculation
X 100
+
Donor/Acceptor
selection
Fig. 3 Image analysis workflow for FRET calculation and image segmentation from a multi-channel spectral
image
Molecular Tension Microscopy of E-Cadherin During EMT
295
473–561 nm bandwidth will capture both fluorophores. This
will generate a multichannel stack.
3.7 Image Analysis
Image analysis can be performed using the free and cross-platform
software ImageJ, for instance its FIJI distribution (https://fiji.sc/)
(see Fig. 3).
1. Make duplicates of the raw data to avoid losses after permanent
modifications (see Note 13). Generate a FRET index image as
follows.
2. Open an image file.
3. From the multichannel stack, duplicate the donor and acceptor
emission channels (D and A) that correspond to the intensity
peaks of the two fluorophores (see Note 14).
4. On both channels, convert image depth to 32-bit
(Image>Type>32-bit).
5. On both channels, subtract background: select a region devoid
of cells and measure background level (Analyze>Measure),
then subtract the value to the whole image (Process>Math>Subtract [Background value]) (see Note 15).
Manual
selection
Region(s) Of Interest
Measure
Spectral image
Segmentation
FRET Index
image
Thresholding
Particle analysis
Acceptor channel
Donor channel
+
32-bit conversion
Background
substraction
Filtering (optional)
FRET calculation
X 100
+
Donor/Acceptor
selection
Fig. 3 Image analysis workflow for FRET calculation and image segmentation from a multi-channel spectral
image
Molecular Tension Microscopy of E-Cadherin During EMT
295