

6. From both channels, generate a donor + acceptor image
(D + A) that sums background corrected, donor and acceptor
signals pixel by pixel. (Process>Image Calculator>Create new
window>32-bit(float) result >[D] Add [A], Create a new
window).
7. From the background corrected, acceptor channel and the sum
image, generate the FRET index image A/(D + A) (Process>Image Calculator>Create new window>32-bit(float) result>
[A] Divide [D + A]).
8. Rescale the pixel values between 0 and 100. (Process>Math>Multiply [100]).
9. Select regions of interest (ROI) with any selection tool, then
measure their mean gray value (Analyze>Measure) to get their
FRET index.
10. Alternatively, ROI can be defined by segmentation based on
fluorescence intensity, size and shape: select the acceptor channel (see Note 16), apply a threshold to select bright regions
(Image>Adjust>Threshold, set to your taste then Apply) (see
Note 17). Choose preferred bright regions according to size
and shape by setting their ranges (Analyze>Analyze Particles,
check Add to Manager) (see Note 18). In the ROI manager
menu, save the ROI set to be able to recall it for future analyses
(More>Save). Select/Open the corresponding FRET Index
image (see Subheading 3.7, step 7) and click Measure in the
ROI manager menu. You will obtain a measure for each ROI of
the set.
3.8 Microscope
Calibration
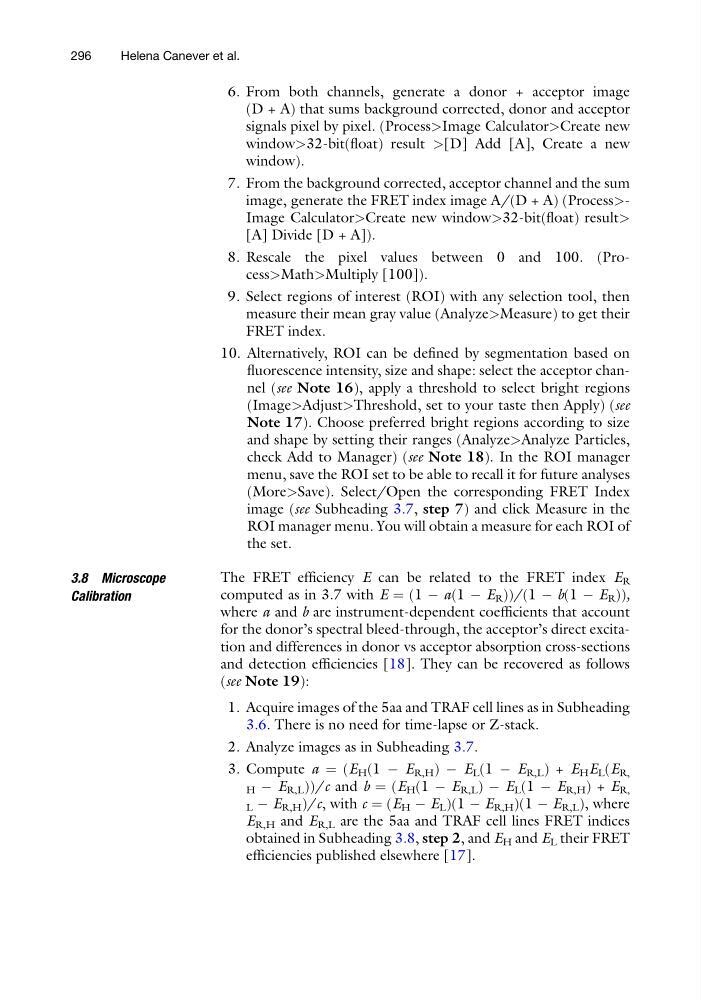
The FRET efficiency E can be related to the FRET index E R
computed as in 3.7 with E ¼ (1 À a(1 À E R ))/(1 À b(1 À E R )),
where a and b are instrument-dependent coefficients that account
for the donor’s spectral bleed-through, the acceptor’s direct excitation and differences in donor vs acceptor absorption cross-sections
and detection efficiencies [18]. They can be recovered as follows
(see Note 19):
1. Acquire images of the 5aa and TRAF cell lines as in Subheading
3.6. There is no need for time-lapse or Z-stack.
2. Analyze images as in Subheading 3.7.
3. Compute a ¼ (E H (1 À E R,H ) À E L (1 À E R,L ) + E H E L (E R,
H À E R,L ))/c and b ¼ (E H (1 À E R,L ) À E L (1 À E R,H ) + E R,
L À E R,H )/c, with c ¼ (E H À E L )(1 À E R,H )(1 À E R,L ), where
E R,H and E R,L are the 5aa and TRAF cell lines FRET indices
obtained in Subheading 3.8, step 2, and E H and E L their FRET
efficiencies published elsewhere [17].
296
Helena Canever et al.
(D + A) that sums background corrected, donor and acceptor
signals pixel by pixel. (Process>Image Calculator>Create new
window>32-bit(float) result >[D] Add [A], Create a new
window).
7. From the background corrected, acceptor channel and the sum
image, generate the FRET index image A/(D + A) (Process>Image Calculator>Create new window>32-bit(float) result>
[A] Divide [D + A]).
8. Rescale the pixel values between 0 and 100. (Process>Math>Multiply [100]).
9. Select regions of interest (ROI) with any selection tool, then
measure their mean gray value (Analyze>Measure) to get their
FRET index.
10. Alternatively, ROI can be defined by segmentation based on
fluorescence intensity, size and shape: select the acceptor channel (see Note 16), apply a threshold to select bright regions
(Image>Adjust>Threshold, set to your taste then Apply) (see
Note 17). Choose preferred bright regions according to size
and shape by setting their ranges (Analyze>Analyze Particles,
check Add to Manager) (see Note 18). In the ROI manager
menu, save the ROI set to be able to recall it for future analyses
(More>Save). Select/Open the corresponding FRET Index
image (see Subheading 3.7, step 7) and click Measure in the
ROI manager menu. You will obtain a measure for each ROI of
the set.
3.8 Microscope
Calibration
The FRET efficiency E can be related to the FRET index E R
computed as in 3.7 with E ¼ (1 À a(1 À E R ))/(1 À b(1 À E R )),
where a and b are instrument-dependent coefficients that account
for the donor’s spectral bleed-through, the acceptor’s direct excitation and differences in donor vs acceptor absorption cross-sections
and detection efficiencies [18]. They can be recovered as follows
(see Note 19):
1. Acquire images of the 5aa and TRAF cell lines as in Subheading
3.6. There is no need for time-lapse or Z-stack.
2. Analyze images as in Subheading 3.7.
3. Compute a ¼ (E H (1 À E R,H ) À E L (1 À E R,L ) + E H E L (E R,
H À E R,L ))/c and b ¼ (E H (1 À E R,L ) À E L (1 À E R,H ) + E R,
L À E R,H )/c, with c ¼ (E H À E L )(1 À E R,H )(1 À E R,L ), where
E R,H and E R,L are the 5aa and TRAF cell lines FRET indices
obtained in Subheading 3.8, step 2, and E H and E L their FRET
efficiencies published elsewhere [17].
296
Helena Canever et al.