

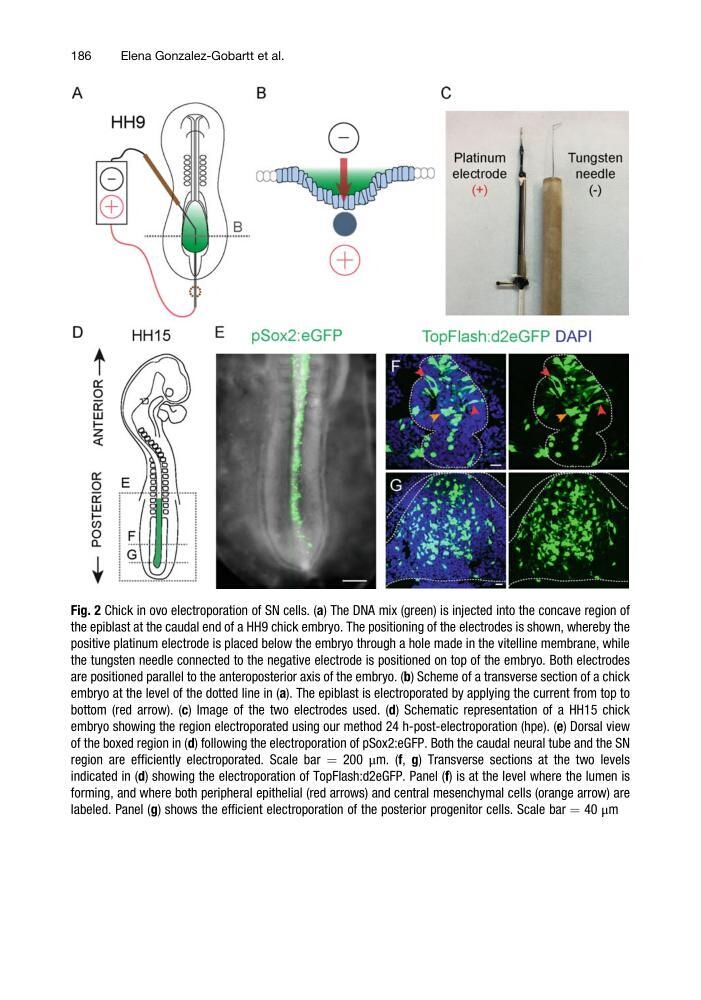
Fig. 2 Chick in ovo electroporation of SN cells. (a) The DNA mix (green) is injected into the concave region of
the epiblast at the caudal end of a HH9 chick embryo. The positioning of the electrodes is shown, whereby the
positive platinum electrode is placed below the embryo through a hole made in the vitelline membrane, while
the tungsten needle connected to the negative electrode is positioned on top of the embryo. Both electrodes
are positioned parallel to the anteroposterior axis of the embryo. (b) Scheme of a transverse section of a chick
embryo at the level of the dotted line in (a). The epiblast is electroporated by applying the current from top to
bottom (red arrow). (c) Image of the two electrodes used. (d) Schematic representation of a HH15 chick
embryo showing the region electroporated using our method 24 h-post-electroporation (hpe). (e) Dorsal view
of the boxed region in (d) following the electroporation of pSox2:eGFP. Both the caudal neural tube and the SN
region are efficiently electroporated. Scale bar ¼ 200 μm. (f, g) Transverse sections at the two levels
indicated in (d) showing the electroporation of TopFlash:d2eGFP. Panel (f) is at the level where the lumen is
forming, and where both peripheral epithelial (red arrows) and central mesenchymal cells (orange arrow) are
labeled. Panel (g) shows the efficient electroporation of the posterior progenitor cells. Scale bar ¼ 40 μm
186
Elena Gonzalez-Gobartt et al.
the epiblast at the caudal end of a HH9 chick embryo. The positioning of the electrodes is shown, whereby the
positive platinum electrode is placed below the embryo through a hole made in the vitelline membrane, while
the tungsten needle connected to the negative electrode is positioned on top of the embryo. Both electrodes
are positioned parallel to the anteroposterior axis of the embryo. (b) Scheme of a transverse section of a chick
embryo at the level of the dotted line in (a). The epiblast is electroporated by applying the current from top to
bottom (red arrow). (c) Image of the two electrodes used. (d) Schematic representation of a HH15 chick
embryo showing the region electroporated using our method 24 h-post-electroporation (hpe). (e) Dorsal view
of the boxed region in (d) following the electroporation of pSox2:eGFP. Both the caudal neural tube and the SN
region are efficiently electroporated. Scale bar ¼ 200 μm. (f, g) Transverse sections at the two levels
indicated in (d) showing the electroporation of TopFlash:d2eGFP. Panel (f) is at the level where the lumen is
forming, and where both peripheral epithelial (red arrows) and central mesenchymal cells (orange arrow) are
labeled. Panel (g) shows the efficient electroporation of the posterior progenitor cells. Scale bar ¼ 40 μm
186
Elena Gonzalez-Gobartt et al.