

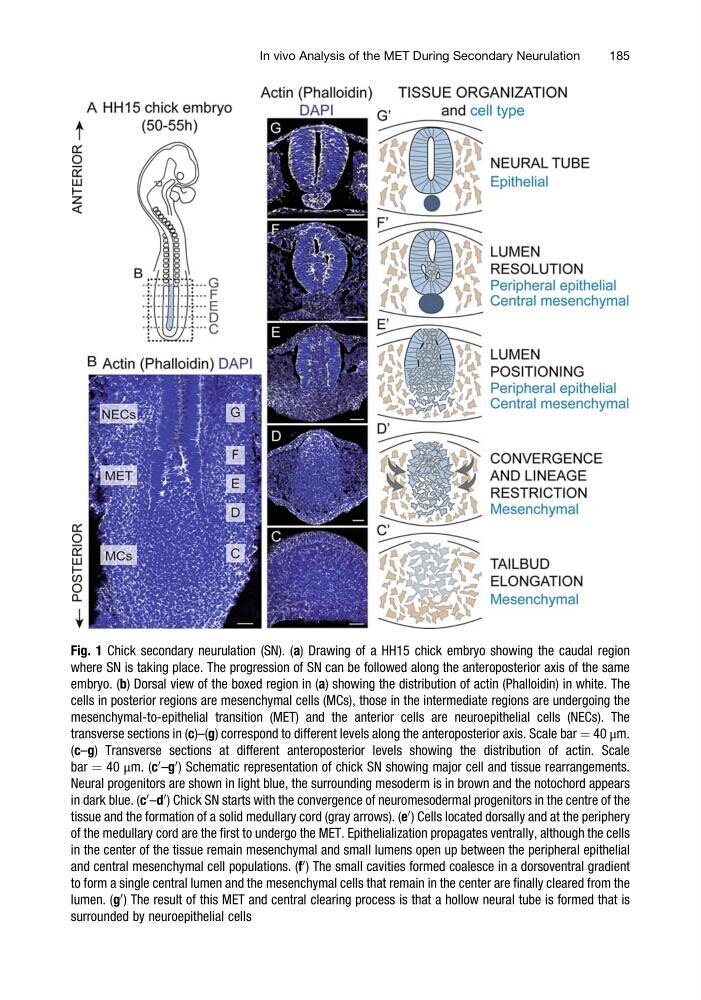
Fig. 1 Chick secondary neurulation (SN). (a) Drawing of a HH15 chick embryo showing the caudal region
where SN is taking place. The progression of SN can be followed along the anteroposterior axis of the same
embryo. (b) Dorsal view of the boxed region in (a) showing the distribution of actin (Phalloidin) in white. The
cells in posterior regions are mesenchymal cells (MCs), those in the intermediate regions are undergoing the
mesenchymal-to-epithelial transition (MET) and the anterior cells are neuroepithelial cells (NECs). The
transverse sections in (c)–(g) correspond to different levels along the anteroposterior axis. Scale bar ¼ 40 μm.
(c–g) Transverse sections at different anteroposterior levels showing the distribution of actin. Scale
bar ¼ 40 μm. (c
0 –g
0 ) Schematic representation of chick SN showing major cell and tissue rearrangements.
Neural progenitors are shown in light blue, the surrounding mesoderm is in brown and the notochord appears
in dark blue. (c
0 –d
0 ) Chick SN starts with the convergence of neuromesodermal progenitors in the centre of the
tissue and the formation of a solid medullary cord (gray arrows). (e
0 ) Cells located dorsally and at the periphery
of the medullary cord are the first to undergo the MET. Epithelialization propagates ventrally, although the cells
in the center of the tissue remain mesenchymal and small lumens open up between the peripheral epithelial
and central mesenchymal cell populations. (f
0 ) The small cavities formed coalesce in a dorsoventral gradient
to form a single central lumen and the mesenchymal cells that remain in the center are finally cleared from the
lumen. (g
0 ) The result of this MET and central clearing process is that a hollow neural tube is formed that is
surrounded by neuroepithelial cells
In vivo Analysis of the MET During Secondary Neurulation
185
where SN is taking place. The progression of SN can be followed along the anteroposterior axis of the same
embryo. (b) Dorsal view of the boxed region in (a) showing the distribution of actin (Phalloidin) in white. The
cells in posterior regions are mesenchymal cells (MCs), those in the intermediate regions are undergoing the
mesenchymal-to-epithelial transition (MET) and the anterior cells are neuroepithelial cells (NECs). The
transverse sections in (c)–(g) correspond to different levels along the anteroposterior axis. Scale bar ¼ 40 μm.
(c–g) Transverse sections at different anteroposterior levels showing the distribution of actin. Scale
bar ¼ 40 μm. (c
0 –g
0 ) Schematic representation of chick SN showing major cell and tissue rearrangements.
Neural progenitors are shown in light blue, the surrounding mesoderm is in brown and the notochord appears
in dark blue. (c
0 –d
0 ) Chick SN starts with the convergence of neuromesodermal progenitors in the centre of the
tissue and the formation of a solid medullary cord (gray arrows). (e
0 ) Cells located dorsally and at the periphery
of the medullary cord are the first to undergo the MET. Epithelialization propagates ventrally, although the cells
in the center of the tissue remain mesenchymal and small lumens open up between the peripheral epithelial
and central mesenchymal cell populations. (f
0 ) The small cavities formed coalesce in a dorsoventral gradient
to form a single central lumen and the mesenchymal cells that remain in the center are finally cleared from the
lumen. (g
0 ) The result of this MET and central clearing process is that a hollow neural tube is formed that is
surrounded by neuroepithelial cells
In vivo Analysis of the MET During Secondary Neurulation
185