

clones per gut. This increases significantly in tumorigenic
situations.
5. This analysis can be extended in Fiji to calculate a number of
additional measures that taken together can be indicative of the
tumor burden—such as the GFP% coverage in a particular
region and the average cell number per clone.
3.4 High-Throughput
Analysis of Total
Tumor Burden in Flies
1. For high-throughput analyses, the presence of the luciferase
reporter can be taken advantage of. To understand how luciferase activity is related to cell number, we previously sorted the
GFP
+ cells from midgut-induced ApcRasSna clones by
fluorescence-activated cell sorting. A linear correlation
(r ¼ 0.9994, p ¼ 0.0006) was observed between the number
of cells isolated and the amount of luciferase activity detected,
allowing us to accurately detect down to 10 cells [6].
2. To measure the tumor burden in whole flies, first squash flies
with a 200 μl pipette tip in lysis buffer. This can be done either
with individual flies or in small batches.
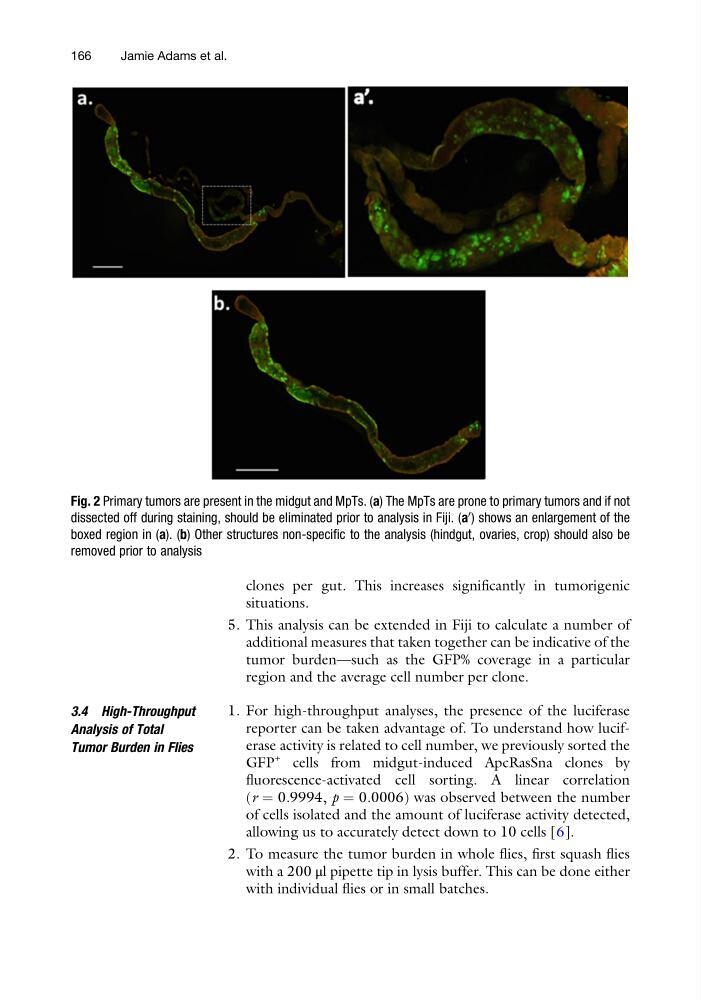
Fig. 2 Primary tumors are present in the midgut and MpTs. (a) The MpTs are prone to primary tumors and if not
dissected off during staining, should be eliminated prior to analysis in Fiji. (a
0 ) shows an enlargement of the
boxed region in (a). (b) Other structures non-specific to the analysis (hindgut, ovaries, crop) should also be
removed prior to analysis
166
Jamie Adams et al.
situations.
5. This analysis can be extended in Fiji to calculate a number of
additional measures that taken together can be indicative of the
tumor burden—such as the GFP% coverage in a particular
region and the average cell number per clone.
3.4 High-Throughput
Analysis of Total
Tumor Burden in Flies
1. For high-throughput analyses, the presence of the luciferase
reporter can be taken advantage of. To understand how luciferase activity is related to cell number, we previously sorted the
GFP
+ cells from midgut-induced ApcRasSna clones by
fluorescence-activated cell sorting. A linear correlation
(r ¼ 0.9994, p ¼ 0.0006) was observed between the number
of cells isolated and the amount of luciferase activity detected,
allowing us to accurately detect down to 10 cells [6].
2. To measure the tumor burden in whole flies, first squash flies
with a 200 μl pipette tip in lysis buffer. This can be done either
with individual flies or in small batches.
Fig. 2 Primary tumors are present in the midgut and MpTs. (a) The MpTs are prone to primary tumors and if not
dissected off during staining, should be eliminated prior to analysis in Fiji. (a
0 ) shows an enlargement of the
boxed region in (a). (b) Other structures non-specific to the analysis (hindgut, ovaries, crop) should also be
removed prior to analysis
166
Jamie Adams et al.