

2 Atomically Precise Nanoclusters as Electrocatalysts
59
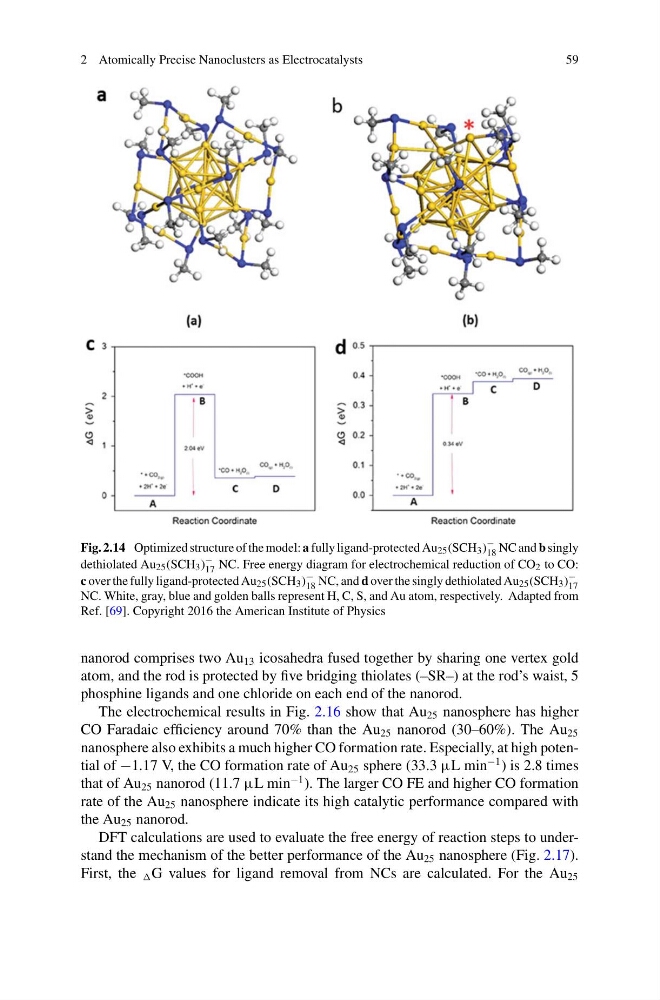
Fig. 2.14 Optimized structure of the model: a fully ligand-protected Au 25 (SCH 3 )
−
18 NC and b singly
dethiolated Au 25 (SCH 3 )
−
17 NC. Free energy diagram for electrochemical reduction of CO 2 to CO:
c over the fully ligand-protected Au 25 (SCH 3 )
−
18 NC, and d over the singly dethiolated Au 25 (SCH 3 )
−
17
NC. White, gray, blue and golden balls represent H, C, S, and Au atom, respectively. Adapted from
Ref. [69]. Copyright 2016 the American Institute of Physics
nanorod comprises two Au 13 icosahedra fused together by sharing one vertex gold
atom, and the rod is protected by five bridging thiolates (–SR–) at the rod’s waist, 5
phosphine ligands and one chloride on each end of the nanorod.
The electrochemical results in Fig. 2.16 show that Au 25 nanosphere has higher
CO Faradaic efficiency around 70% than the Au 25 nanorod (30–60%). The Au 25
nanosphere also exhibits a much higher CO formation rate. Especially, at high potential of −1.17 V, the CO formation rate of Au 25 sphere (33.3 μL min
−1 ) is 2.8 times
that of Au 25 nanorod (11.7 μL min
−1 ). The larger CO FE and higher CO formation
rate of the Au 25 nanosphere indicate its high catalytic performance compared with
the Au 25 nanorod.
DFT calculations are used to evaluate the free energy of reaction steps to understand the mechanism of the better performance of the Au 25 nanosphere (Fig. 2.17).
First, the G values for ligand removal from NCs are calculated. For the Au 25
59
Fig. 2.14 Optimized structure of the model: a fully ligand-protected Au 25 (SCH 3 )
−
18 NC and b singly
dethiolated Au 25 (SCH 3 )
−
17 NC. Free energy diagram for electrochemical reduction of CO 2 to CO:
c over the fully ligand-protected Au 25 (SCH 3 )
−
18 NC, and d over the singly dethiolated Au 25 (SCH 3 )
−
17
NC. White, gray, blue and golden balls represent H, C, S, and Au atom, respectively. Adapted from
Ref. [69]. Copyright 2016 the American Institute of Physics
nanorod comprises two Au 13 icosahedra fused together by sharing one vertex gold
atom, and the rod is protected by five bridging thiolates (–SR–) at the rod’s waist, 5
phosphine ligands and one chloride on each end of the nanorod.
The electrochemical results in Fig. 2.16 show that Au 25 nanosphere has higher
CO Faradaic efficiency around 70% than the Au 25 nanorod (30–60%). The Au 25
nanosphere also exhibits a much higher CO formation rate. Especially, at high potential of −1.17 V, the CO formation rate of Au 25 sphere (33.3 μL min
−1 ) is 2.8 times
that of Au 25 nanorod (11.7 μL min
−1 ). The larger CO FE and higher CO formation
rate of the Au 25 nanosphere indicate its high catalytic performance compared with
the Au 25 nanorod.
DFT calculations are used to evaluate the free energy of reaction steps to understand the mechanism of the better performance of the Au 25 nanosphere (Fig. 2.17).
First, the G values for ligand removal from NCs are calculated. For the Au 25