

54
S. Li and R. Jin
2.5.2 Size Effect of Au NCs in ORR
Au NCs were first reported for ORR by Chen et al. in 2009 [55]. Four Au NCs
with different sizes: Au 11 , Au ~25 , Au ~55 , and Au ~140 are synthesized. (On a note, we
found that the UV-vis spectrum of “Au 11 ” [55] instead resembles that of the Au 25
rod cluster [1]). In the electrochemical test, it was found that the “Au 11 ” exhibits
the highest limiting current density and smallest overpotential in ORR. Overall,
the catalytic activity decreases as the cluster size increases. However, the crystal
structures of Au NCs were not obtained at that time. Therefore, the assignment of
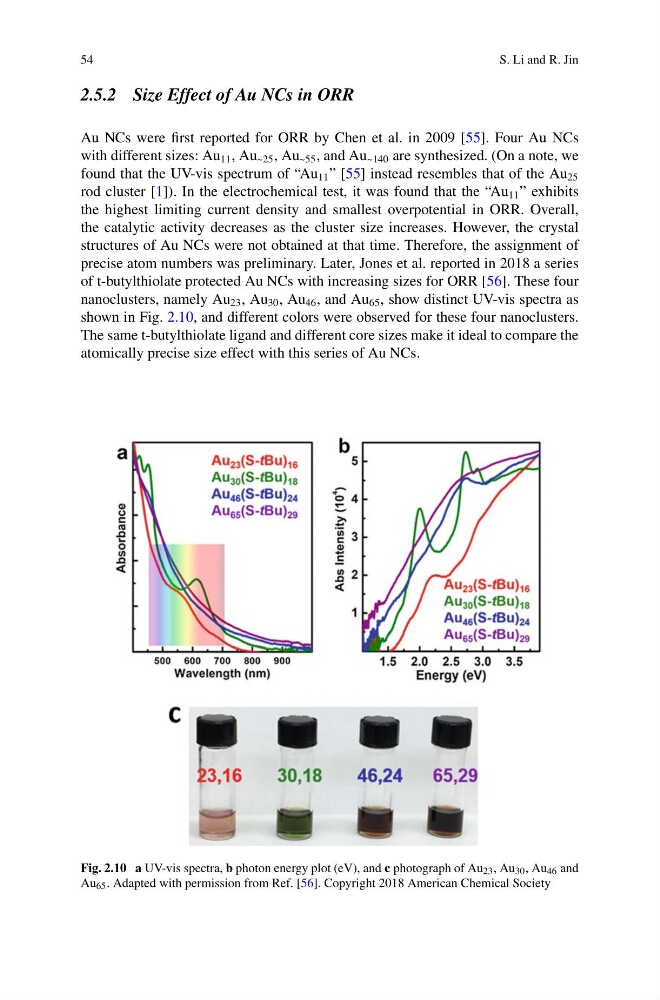
precise atom numbers was preliminary. Later, Jones et al. reported in 2018 a series
of t-butylthiolate protected Au NCs with increasing sizes for ORR [56]. These four
nanoclusters, namely Au 23 , Au 30 , Au 46 , and Au 65 , show distinct UV-vis spectra as
shown in Fig. 2.10, and different colors were observed for these four nanoclusters.
The same t-butylthiolate ligand and different core sizes make it ideal to compare the
atomically precise size effect with this series of Au NCs.
Fig. 2.10 a UV-vis spectra, b photon energy plot (eV), and c photograph of Au 23 , Au 30 , Au 46 and
Au 65 . Adapted with permission from Ref. [56]. Copyright 2018 American Chemical Society
S. Li and R. Jin
2.5.2 Size Effect of Au NCs in ORR
Au NCs were first reported for ORR by Chen et al. in 2009 [55]. Four Au NCs
with different sizes: Au 11 , Au ~25 , Au ~55 , and Au ~140 are synthesized. (On a note, we
found that the UV-vis spectrum of “Au 11 ” [55] instead resembles that of the Au 25
rod cluster [1]). In the electrochemical test, it was found that the “Au 11 ” exhibits
the highest limiting current density and smallest overpotential in ORR. Overall,
the catalytic activity decreases as the cluster size increases. However, the crystal
structures of Au NCs were not obtained at that time. Therefore, the assignment of
precise atom numbers was preliminary. Later, Jones et al. reported in 2018 a series
of t-butylthiolate protected Au NCs with increasing sizes for ORR [56]. These four
nanoclusters, namely Au 23 , Au 30 , Au 46 , and Au 65 , show distinct UV-vis spectra as
shown in Fig. 2.10, and different colors were observed for these four nanoclusters.
The same t-butylthiolate ligand and different core sizes make it ideal to compare the
atomically precise size effect with this series of Au NCs.
Fig. 2.10 a UV-vis spectra, b photon energy plot (eV), and c photograph of Au 23 , Au 30 , Au 46 and
Au 65 . Adapted with permission from Ref. [56]. Copyright 2018 American Chemical Society