

2 Atomically Precise Nanoclusters as Electrocatalysts
53
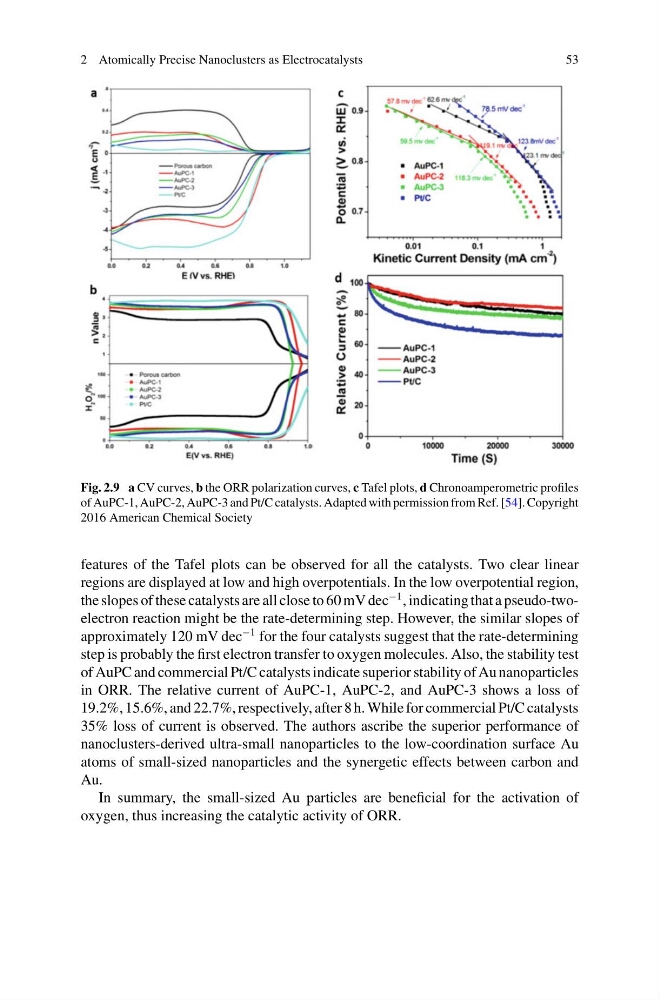
Fig. 2.9 a CV curves, b the ORR polarization curves, c Tafel plots, d Chronoamperometric profiles
of AuPC-1, AuPC-2, AuPC-3 and Pt/C catalysts. Adapted with permission from Ref. [54]. Copyright
2016 American Chemical Society
features of the Tafel plots can be observed for all the catalysts. Two clear linear
regions are displayed at low and high overpotentials. In the low overpotential region,
the slopes of these catalysts are all close to 60 mV dec
−1 , indicating that a pseudo-twoelectron reaction might be the rate-determining step. However, the similar slopes of
approximately 120 mV dec
−1 for the four catalysts suggest that the rate-determining
step is probably the first electron transfer to oxygen molecules. Also, the stability test
of AuPC and commercial Pt/C catalysts indicate superior stability of Au nanoparticles
in ORR. The relative current of AuPC-1, AuPC-2, and AuPC-3 shows a loss of
19.2%, 15.6%, and 22.7%, respectively, after 8 h. While for commercial Pt/C catalysts
35% loss of current is observed. The authors ascribe the superior performance of
nanoclusters-derived ultra-small nanoparticles to the low-coordination surface Au
atoms of small-sized nanoparticles and the synergetic effects between carbon and
Au.
In summary, the small-sized Au particles are beneficial for the activation of
oxygen, thus increasing the catalytic activity of ORR.
53
Fig. 2.9 a CV curves, b the ORR polarization curves, c Tafel plots, d Chronoamperometric profiles
of AuPC-1, AuPC-2, AuPC-3 and Pt/C catalysts. Adapted with permission from Ref. [54]. Copyright
2016 American Chemical Society
features of the Tafel plots can be observed for all the catalysts. Two clear linear
regions are displayed at low and high overpotentials. In the low overpotential region,
the slopes of these catalysts are all close to 60 mV dec
−1 , indicating that a pseudo-twoelectron reaction might be the rate-determining step. However, the similar slopes of
approximately 120 mV dec
−1 for the four catalysts suggest that the rate-determining
step is probably the first electron transfer to oxygen molecules. Also, the stability test
of AuPC and commercial Pt/C catalysts indicate superior stability of Au nanoparticles
in ORR. The relative current of AuPC-1, AuPC-2, and AuPC-3 shows a loss of
19.2%, 15.6%, and 22.7%, respectively, after 8 h. While for commercial Pt/C catalysts
35% loss of current is observed. The authors ascribe the superior performance of
nanoclusters-derived ultra-small nanoparticles to the low-coordination surface Au
atoms of small-sized nanoparticles and the synergetic effects between carbon and
Au.
In summary, the small-sized Au particles are beneficial for the activation of
oxygen, thus increasing the catalytic activity of ORR.