

52
S. Li and R. Jin
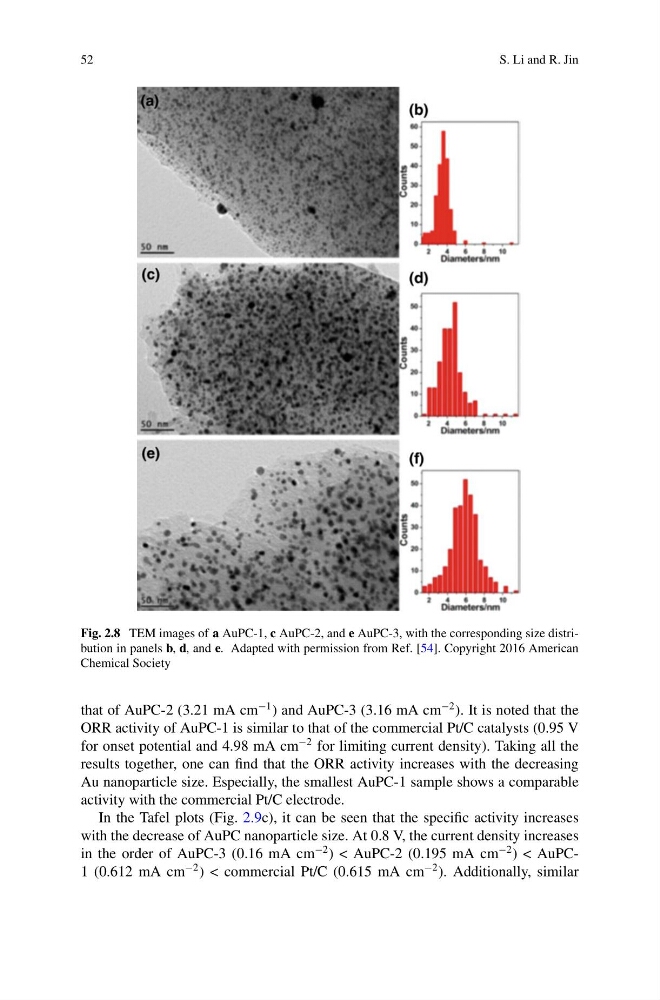
Fig. 2.8 TEM images of a AuPC-1, c AuPC-2, and e AuPC-3, with the corresponding size distribution in panels b, d, and e. Adapted with permission from Ref. [54]. Copyright 2016 American
Chemical Society
that of AuPC-2 (3.21 mA cm
−1 ) and AuPC-3 (3.16 mA cm
−2 ). It is noted that the
ORR activity of AuPC-1 is similar to that of the commercial Pt/C catalysts (0.95 V
for onset potential and 4.98 mA cm
−2 for limiting current density). Taking all the
results together, one can find that the ORR activity increases with the decreasing
Au nanoparticle size. Especially, the smallest AuPC-1 sample shows a comparable
activity with the commercial Pt/C electrode.
In the Tafel plots (Fig. 2.9c), it can be seen that the specific activity increases
with the decrease of AuPC nanoparticle size. At 0.8 V, the current density increases
in the order of AuPC-3 (0.16 mA cm
−2 ) < AuPC-2 (0.195 mA cm
−2 ) < AuPC1 (0.612 mA cm
−2 ) < commercial Pt/C (0.615 mA cm
−2 ). Additionally, similar
S. Li and R. Jin
Fig. 2.8 TEM images of a AuPC-1, c AuPC-2, and e AuPC-3, with the corresponding size distribution in panels b, d, and e. Adapted with permission from Ref. [54]. Copyright 2016 American
Chemical Society
that of AuPC-2 (3.21 mA cm
−1 ) and AuPC-3 (3.16 mA cm
−2 ). It is noted that the
ORR activity of AuPC-1 is similar to that of the commercial Pt/C catalysts (0.95 V
for onset potential and 4.98 mA cm
−2 for limiting current density). Taking all the
results together, one can find that the ORR activity increases with the decreasing
Au nanoparticle size. Especially, the smallest AuPC-1 sample shows a comparable
activity with the commercial Pt/C electrode.
In the Tafel plots (Fig. 2.9c), it can be seen that the specific activity increases
with the decrease of AuPC nanoparticle size. At 0.8 V, the current density increases
in the order of AuPC-3 (0.16 mA cm
−2 ) < AuPC-2 (0.195 mA cm
−2 ) < AuPC1 (0.612 mA cm
−2 ) < commercial Pt/C (0.615 mA cm
−2 ). Additionally, similar