

178
7 Molecular Structures from Gas-Phase Electron Diffraction
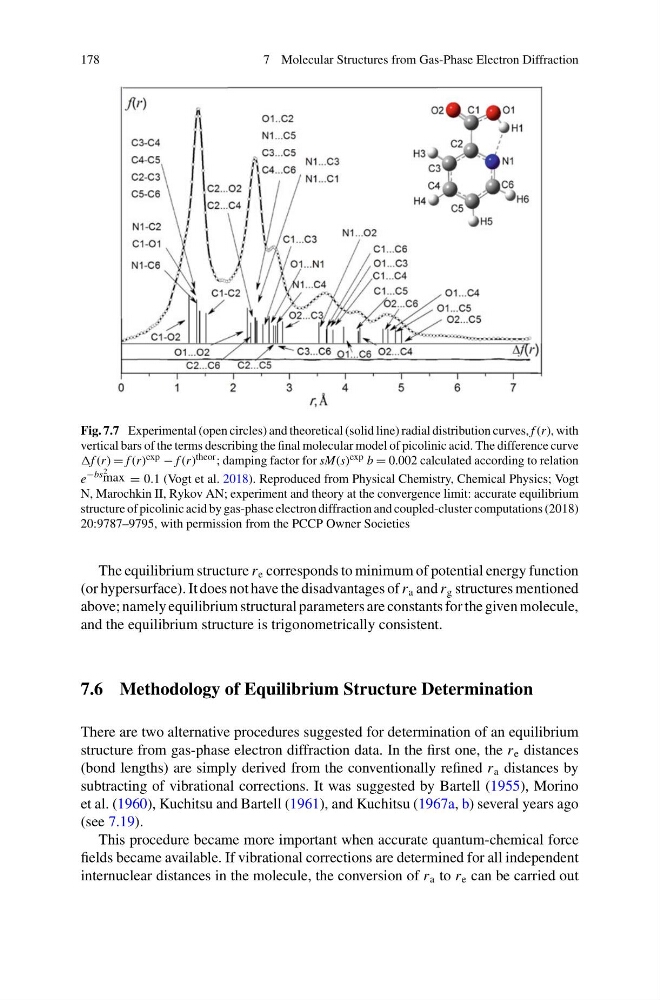
Fig. 7.7 Experimental (open circles) and theoretical (solid line) radial distribution curves, f (r), with
vertical bars of the terms describing the final molecular model of picolinic acid. The difference curve
f (r) = f (r) exp − f (r) theor ; damping factor for sM(s) exp b = 0.002 calculated according to relation
e
−bs 2
max = 0.1 (Vogt et al. 2018). Reproduced from Physical Chemistry, Chemical Physics; Vogt
N, Marochkin II, Rykov AN; experiment and theory at the convergence limit: accurate equilibrium
structure of picolinic acid by gas-phase electron diffraction and coupled-cluster computations (2018)
20:9787–9795, with permission from the PCCP Owner Societies
The equilibrium structure r e corresponds to minimum of potential energy function
(or hypersurface). It does not have the disadvantages of r a and r g structures mentioned
above; namely equilibrium structural parameters are constants for the given molecule,
and the equilibrium structure is trigonometrically consistent.
7.6 Methodology of Equilibrium Structure Determination
There are two alternative procedures suggested for determination of an equilibrium
structure from gas-phase electron diffraction data. In the first one, the r e distances
(bond lengths) are simply derived from the conventionally refined r a distances by
subtracting of vibrational corrections. It was suggested by Bartell (1955), Morino
et al. (1960), Kuchitsu and Bartell (1961), and Kuchitsu (1967a, b) several years ago
(see 7.19).
This procedure became more important when accurate quantum-chemical force
fields became available. If vibrational corrections are determined for all independent
internuclear distances in the molecule, the conversion of r a to r e can be carried out
7 Molecular Structures from Gas-Phase Electron Diffraction
Fig. 7.7 Experimental (open circles) and theoretical (solid line) radial distribution curves, f (r), with
vertical bars of the terms describing the final molecular model of picolinic acid. The difference curve
f (r) = f (r) exp − f (r) theor ; damping factor for sM(s) exp b = 0.002 calculated according to relation
e
−bs 2
max = 0.1 (Vogt et al. 2018). Reproduced from Physical Chemistry, Chemical Physics; Vogt
N, Marochkin II, Rykov AN; experiment and theory at the convergence limit: accurate equilibrium
structure of picolinic acid by gas-phase electron diffraction and coupled-cluster computations (2018)
20:9787–9795, with permission from the PCCP Owner Societies
The equilibrium structure r e corresponds to minimum of potential energy function
(or hypersurface). It does not have the disadvantages of r a and r g structures mentioned
above; namely equilibrium structural parameters are constants for the given molecule,
and the equilibrium structure is trigonometrically consistent.
7.6 Methodology of Equilibrium Structure Determination
There are two alternative procedures suggested for determination of an equilibrium
structure from gas-phase electron diffraction data. In the first one, the r e distances
(bond lengths) are simply derived from the conventionally refined r a distances by
subtracting of vibrational corrections. It was suggested by Bartell (1955), Morino
et al. (1960), Kuchitsu and Bartell (1961), and Kuchitsu (1967a, b) several years ago
(see 7.19).
This procedure became more important when accurate quantum-chemical force
fields became available. If vibrational corrections are determined for all independent
internuclear distances in the molecule, the conversion of r a to r e can be carried out