

7.4 Main Theoretical Expressions
175
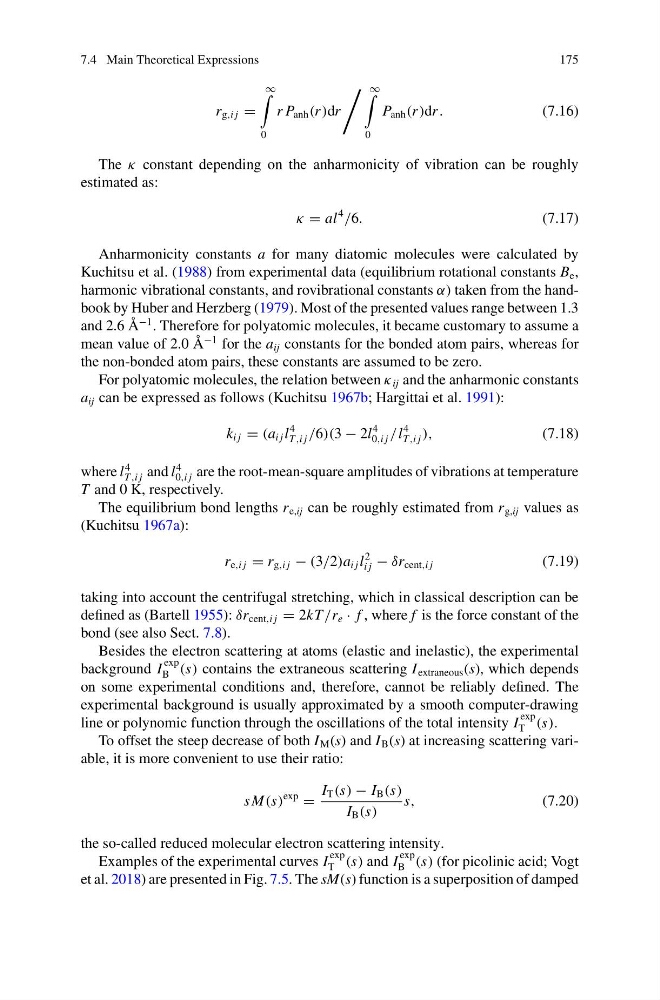
r g,i j =
∞
0
r P anh (r )dr
∞
0
P anh (r )dr .
(7.16)
The κ constant depending on the anharmonicity of vibration can be roughly
estimated as:
κ = al
4
/6.
(7.17)
Anharmonicity constants a for many diatomic molecules were calculated by
Kuchitsu et al. (1988) from experimental data (equilibrium rotational constants B e ,
harmonic vibrational constants, and rovibrational constants α) taken from the handbook by Huber and Herzberg (1979). Most of the presented values range between 1.3
and 2.6 Å
−1 . Therefore for polyatomic molecules, it became customary to assume a
mean value of 2.0 Å
−1 for the a ij constants for the bonded atom pairs, whereas for
the non-bonded atom pairs, these constants are assumed to be zero.
For polyatomic molecules, the relation between κ ij and the anharmonic constants
a ij can be expressed as follows (Kuchitsu 1967b; Hargittai et al. 1991):
k i j = (a i j l
4
T,i j /6)(3 − 2l
4
0,i j /l
4
T,i j ),
(7.18)
where l
4
T,i j and l
4
0,i j are the root-mean-square amplitudes of vibrations at temperature
T and 0 K, respectively.
The equilibrium bond lengths r e,ij can be roughly estimated from r g,ij values as
(Kuchitsu 1967a):
r e,i j = r g,i j − (3/2)a i j l
2
i j − δr cent,i j
(7.19)
taking into account the centrifugal stretching, which in classical description can be
defined as (Bartell 1955): δr cent,i j = 2kT /r e · f , where f is the force constant of the
bond (see also Sect. 7.8).
Besides the electron scattering at atoms (elastic and inelastic), the experimental
background I
exp
B (s) contains the extraneous scattering I extraneous (s), which depends
on some experimental conditions and, therefore, cannot be reliably defined. The
experimental background is usually approximated by a smooth computer-drawing
line or polynomic function through the oscillations of the total intensity I
exp
T (s).
To offset the steep decrease of both I M (s) and I B (s) at increasing scattering variable, it is more convenient to use their ratio:
s M(s)
exp
=
I T (s) − I B (s)
I B (s)
s,
(7.20)
the so-called reduced molecular electron scattering intensity.
Examples of the experimental curves I
exp
T (s) and I
exp
B (s) (for picolinic acid; Vogt
et al. 2018) are presented in Fig. 7.5. The sM(s) function is a superposition of damped
175
r g,i j =
∞
0
r P anh (r )dr
∞
0
P anh (r )dr .
(7.16)
The κ constant depending on the anharmonicity of vibration can be roughly
estimated as:
κ = al
4
/6.
(7.17)
Anharmonicity constants a for many diatomic molecules were calculated by
Kuchitsu et al. (1988) from experimental data (equilibrium rotational constants B e ,
harmonic vibrational constants, and rovibrational constants α) taken from the handbook by Huber and Herzberg (1979). Most of the presented values range between 1.3
and 2.6 Å
−1 . Therefore for polyatomic molecules, it became customary to assume a
mean value of 2.0 Å
−1 for the a ij constants for the bonded atom pairs, whereas for
the non-bonded atom pairs, these constants are assumed to be zero.
For polyatomic molecules, the relation between κ ij and the anharmonic constants
a ij can be expressed as follows (Kuchitsu 1967b; Hargittai et al. 1991):
k i j = (a i j l
4
T,i j /6)(3 − 2l
4
0,i j /l
4
T,i j ),
(7.18)
where l
4
T,i j and l
4
0,i j are the root-mean-square amplitudes of vibrations at temperature
T and 0 K, respectively.
The equilibrium bond lengths r e,ij can be roughly estimated from r g,ij values as
(Kuchitsu 1967a):
r e,i j = r g,i j − (3/2)a i j l
2
i j − δr cent,i j
(7.19)
taking into account the centrifugal stretching, which in classical description can be
defined as (Bartell 1955): δr cent,i j = 2kT /r e · f , where f is the force constant of the
bond (see also Sect. 7.8).
Besides the electron scattering at atoms (elastic and inelastic), the experimental
background I
exp
B (s) contains the extraneous scattering I extraneous (s), which depends
on some experimental conditions and, therefore, cannot be reliably defined. The
experimental background is usually approximated by a smooth computer-drawing
line or polynomic function through the oscillations of the total intensity I
exp
T (s).
To offset the steep decrease of both I M (s) and I B (s) at increasing scattering variable, it is more convenient to use their ratio:
s M(s)
exp
=
I T (s) − I B (s)
I B (s)
s,
(7.20)
the so-called reduced molecular electron scattering intensity.
Examples of the experimental curves I
exp
T (s) and I
exp
B (s) (for picolinic acid; Vogt
et al. 2018) are presented in Fig. 7.5. The sM(s) function is a superposition of damped