

transfer between excited donor and acceptor chromophores when the molecules are
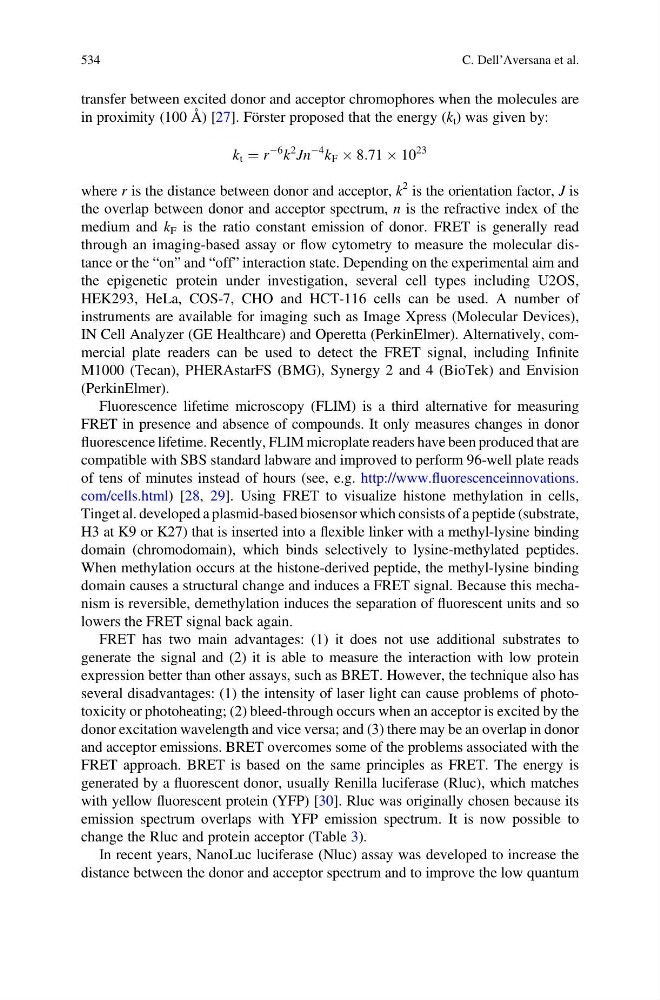
in proximity (100 Å) [27]. Förster proposed that the energy (k t ) was given by:
k t ¼ r
À6
k
2
Jn
À4
k F Â 8:71 Â 10
23
where r is the distance between donor and acceptor, k
2 is the orientation factor, J is
the overlap between donor and acceptor spectrum, n is the refractive index of the
medium and k F is the ratio constant emission of donor. FRET is generally read
through an imaging-based assay or flow cytometry to measure the molecular distance or the “on” and “off” interaction state. Depending on the experimental aim and
the epigenetic protein under investigation, several cell types including U2OS,
HEK293, HeLa, COS-7, CHO and HCT-116 cells can be used. A number of
instruments are available for imaging such as Image Xpress (Molecular Devices),
IN Cell Analyzer (GE Healthcare) and Operetta (PerkinElmer). Alternatively, commercial plate readers can be used to detect the FRET signal, including Infinite
M1000 (Tecan), PHERAstarFS (BMG), Synergy 2 and 4 (BioTek) and Envision
(PerkinElmer).
Fluorescence lifetime microscopy (FLIM) is a third alternative for measuring
FRET in presence and absence of compounds. It only measures changes in donor
fluorescence lifetime. Recently, FLIM microplate readers have been produced that are
compatible with SBS standard labware and improved to perform 96-well plate reads
of tens of minutes instead of hours (see, e.g. http://www.fluorescenceinnovations.
com/cells.html) [28, 29]. Using FRET to visualize histone methylation in cells,
Tinget al. developed a plasmid-based biosensor which consists of a peptide (substrate,
H3 at K9 or K27) that is inserted into a flexible linker with a methyl-lysine binding
domain (chromodomain), which binds selectively to lysine-methylated peptides.
When methylation occurs at the histone-derived peptide, the methyl-lysine binding
domain causes a structural change and induces a FRET signal. Because this mechanism is reversible, demethylation induces the separation of fluorescent units and so
lowers the FRET signal back again.
FRET has two main advantages: (1) it does not use additional substrates to
generate the signal and (2) it is able to measure the interaction with low protein
expression better than other assays, such as BRET. However, the technique also has
several disadvantages: (1) the intensity of laser light can cause problems of phototoxicity or photoheating; (2) bleed-through occurs when an acceptor is excited by the
donor excitation wavelength and vice versa; and (3) there may be an overlap in donor
and acceptor emissions. BRET overcomes some of the problems associated with the
FRET approach. BRET is based on the same principles as FRET. The energy is
generated by a fluorescent donor, usually Renilla luciferase (Rluc), which matches
with yellow fluorescent protein (YFP) [30]. Rluc was originally chosen because its
emission spectrum overlaps with YFP emission spectrum. It is now possible to
change the Rluc and protein acceptor (Table 3).
In recent years, NanoLuc luciferase (Nluc) assay was developed to increase the
distance between the donor and acceptor spectrum and to improve the low quantum
534
C. Dell’Aversana et al.
in proximity (100 Å) [27]. Förster proposed that the energy (k t ) was given by:
k t ¼ r
À6
k
2
Jn
À4
k F Â 8:71 Â 10
23
where r is the distance between donor and acceptor, k
2 is the orientation factor, J is
the overlap between donor and acceptor spectrum, n is the refractive index of the
medium and k F is the ratio constant emission of donor. FRET is generally read
through an imaging-based assay or flow cytometry to measure the molecular distance or the “on” and “off” interaction state. Depending on the experimental aim and
the epigenetic protein under investigation, several cell types including U2OS,
HEK293, HeLa, COS-7, CHO and HCT-116 cells can be used. A number of
instruments are available for imaging such as Image Xpress (Molecular Devices),
IN Cell Analyzer (GE Healthcare) and Operetta (PerkinElmer). Alternatively, commercial plate readers can be used to detect the FRET signal, including Infinite
M1000 (Tecan), PHERAstarFS (BMG), Synergy 2 and 4 (BioTek) and Envision
(PerkinElmer).
Fluorescence lifetime microscopy (FLIM) is a third alternative for measuring
FRET in presence and absence of compounds. It only measures changes in donor
fluorescence lifetime. Recently, FLIM microplate readers have been produced that are
compatible with SBS standard labware and improved to perform 96-well plate reads
of tens of minutes instead of hours (see, e.g. http://www.fluorescenceinnovations.
com/cells.html) [28, 29]. Using FRET to visualize histone methylation in cells,
Tinget al. developed a plasmid-based biosensor which consists of a peptide (substrate,
H3 at K9 or K27) that is inserted into a flexible linker with a methyl-lysine binding
domain (chromodomain), which binds selectively to lysine-methylated peptides.
When methylation occurs at the histone-derived peptide, the methyl-lysine binding
domain causes a structural change and induces a FRET signal. Because this mechanism is reversible, demethylation induces the separation of fluorescent units and so
lowers the FRET signal back again.
FRET has two main advantages: (1) it does not use additional substrates to
generate the signal and (2) it is able to measure the interaction with low protein
expression better than other assays, such as BRET. However, the technique also has
several disadvantages: (1) the intensity of laser light can cause problems of phototoxicity or photoheating; (2) bleed-through occurs when an acceptor is excited by the
donor excitation wavelength and vice versa; and (3) there may be an overlap in donor
and acceptor emissions. BRET overcomes some of the problems associated with the
FRET approach. BRET is based on the same principles as FRET. The energy is
generated by a fluorescent donor, usually Renilla luciferase (Rluc), which matches
with yellow fluorescent protein (YFP) [30]. Rluc was originally chosen because its
emission spectrum overlaps with YFP emission spectrum. It is now possible to
change the Rluc and protein acceptor (Table 3).
In recent years, NanoLuc luciferase (Nluc) assay was developed to increase the
distance between the donor and acceptor spectrum and to improve the low quantum
534
C. Dell’Aversana et al.