

31
Relief maps show real Earth’s crust surfaces.
Relief maps with contour lines are able to plot in
plain spatial three dimensions, however, they
cannot substitute real three-dimensional models.
Three-dimensional models are used in various
scientific fields. In chemistry, for example, the
spatial structure of molecules is illustrated by
three-dimensional models. In medical science the
human organism or its parts are mapped by spatial models. In engineering science laboratory
experiments are carried out on reduced sized
models of otherwise huge buildings and structures. And the list could be continued.
In geographical (and also in wider earth scientific) research block sections have been used for a
long time in which both the Earth’s surface and
the internal structure of the crust can be shown.
Today the computer software background is so
developed that the application of threedimensional (3D) models is regarded a routine
task (Fig. 2.14). Compared to traditional, graphically displayed, handmade block sections using
rulers, modern 3D models created with geoinformatic methods have numerous advantages. First
of all, they are more accurate and can be rotated
virtually thus the realistic spatial structure could
be studied and measured from any direction.
The evolution of informatics and computer
technology made the creation of four- dimensional
(4D) models also possible. Such models also
show the changes of the given system in time
apart from its spatial visualization. Their greatest
advantage is that the dynamics of the changes can
be analysed as well. Scientific four-dimensional
models are based on complex equation systems.
For example, dynamic climate models are examples of such models.
2.6
Earth Models, “World
Models”
As it was mentioned before, Earth is a multiply
complex, very complicated system that is simply
called a complex system. Earth scientists have not
even tried to create a unified isomorphic system
model of this complex system gathering all subsystems into a unit.
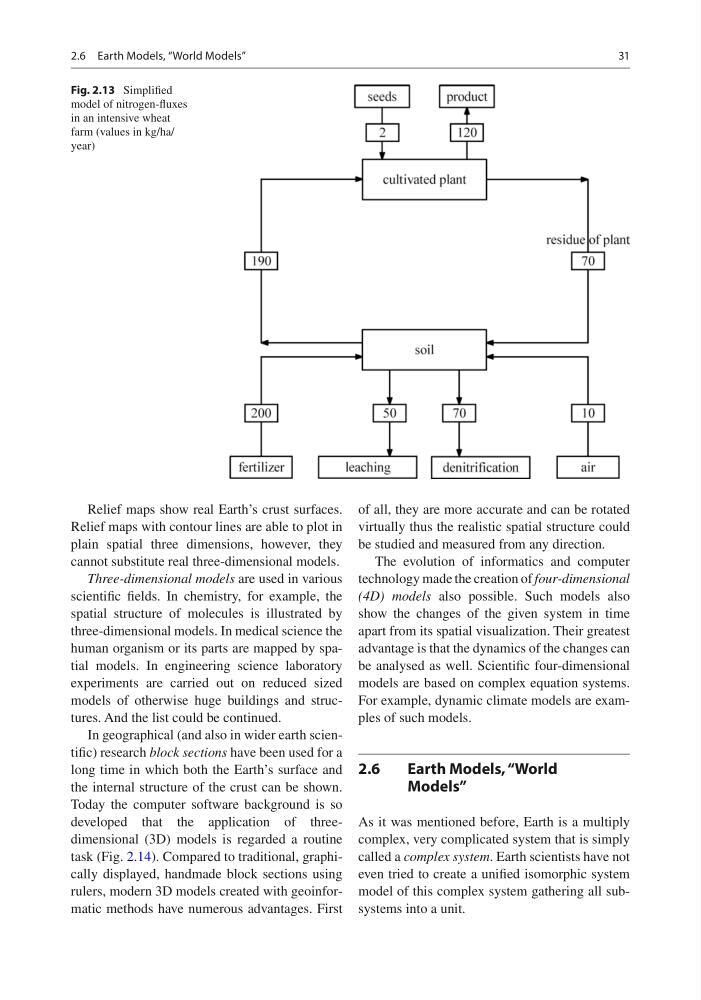
Fig. 2.13 Simplified
model of nitrogen-fluxes
in an intensive wheat
farm (values in kg/ha/
year)
2.6 Earth Models, “World Models”
Relief maps show real Earth’s crust surfaces.
Relief maps with contour lines are able to plot in
plain spatial three dimensions, however, they
cannot substitute real three-dimensional models.
Three-dimensional models are used in various
scientific fields. In chemistry, for example, the
spatial structure of molecules is illustrated by
three-dimensional models. In medical science the
human organism or its parts are mapped by spatial models. In engineering science laboratory
experiments are carried out on reduced sized
models of otherwise huge buildings and structures. And the list could be continued.
In geographical (and also in wider earth scientific) research block sections have been used for a
long time in which both the Earth’s surface and
the internal structure of the crust can be shown.
Today the computer software background is so
developed that the application of threedimensional (3D) models is regarded a routine
task (Fig. 2.14). Compared to traditional, graphically displayed, handmade block sections using
rulers, modern 3D models created with geoinformatic methods have numerous advantages. First
of all, they are more accurate and can be rotated
virtually thus the realistic spatial structure could
be studied and measured from any direction.
The evolution of informatics and computer
technology made the creation of four- dimensional
(4D) models also possible. Such models also
show the changes of the given system in time
apart from its spatial visualization. Their greatest
advantage is that the dynamics of the changes can
be analysed as well. Scientific four-dimensional
models are based on complex equation systems.
For example, dynamic climate models are examples of such models.
2.6
Earth Models, “World
Models”
As it was mentioned before, Earth is a multiply
complex, very complicated system that is simply
called a complex system. Earth scientists have not
even tried to create a unified isomorphic system
model of this complex system gathering all subsystems into a unit.
Fig. 2.13 Simplified
model of nitrogen-fluxes
in an intensive wheat
farm (values in kg/ha/
year)
2.6 Earth Models, “World Models”