

189
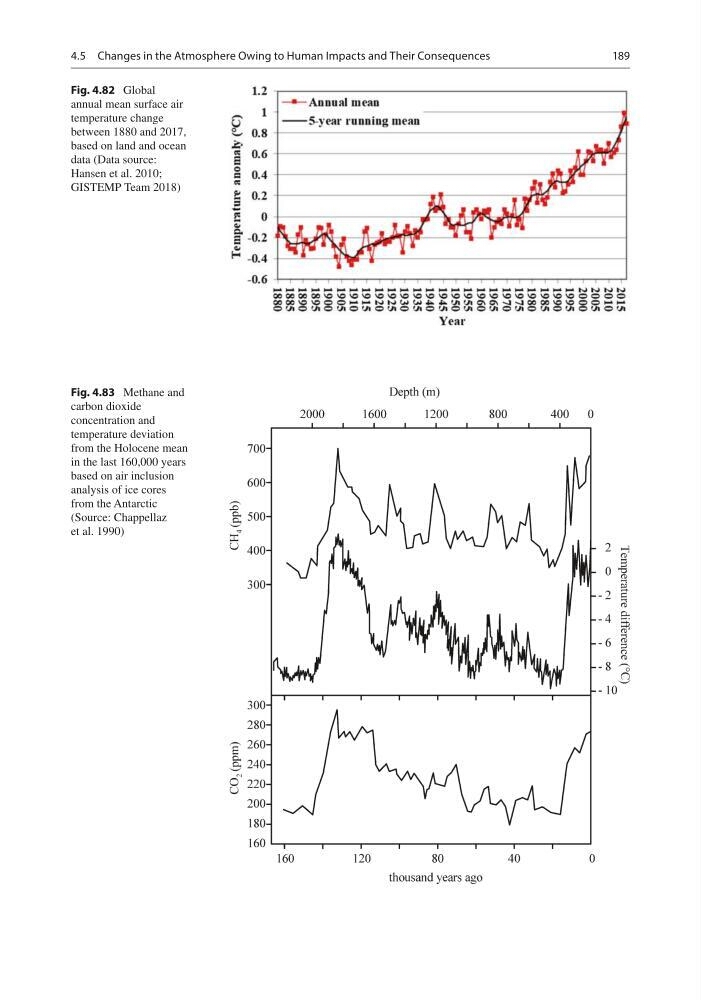
Fig. 4.82 Global
annual mean surface air
temperature change
between 1880 and 2017,
based on land and ocean
data (Data source:
Hansen et al. 2010;
GISTEMP Team 2018)
Fig. 4.83 Methane and
carbon dioxide
concentration and
temperature deviation
from the Holocene mean
in the last 160,000 years
based on air inclusion
analysis of ice cores
from the Antarctic
(Source: Chappellaz
et al. 1990)
4.5 Changes in the Atmosphere Owing to Human Impacts and Their Consequences
Fig. 4.82 Global
annual mean surface air
temperature change
between 1880 and 2017,
based on land and ocean
data (Data source:
Hansen et al. 2010;
GISTEMP Team 2018)
Fig. 4.83 Methane and
carbon dioxide
concentration and
temperature deviation
from the Holocene mean
in the last 160,000 years
based on air inclusion
analysis of ice cores
from the Antarctic
(Source: Chappellaz
et al. 1990)
4.5 Changes in the Atmosphere Owing to Human Impacts and Their Consequences