

107
tions. In developed countries this ratio is so high
even today that further growth can be only slight.
Cities utilise currently 75% of natural resources
and more than half of the amount of waste is produced in cities.
Urbanisation gained momentum in Europe
around one and a half centuries ago but nowadays
its engine is found in developing countries, especially in Asia. Typically the population of a major
city grows at an immeasurable rate while the
infrastructure of the city cannot keep up the pace.
Cities targeted by immigration expand to
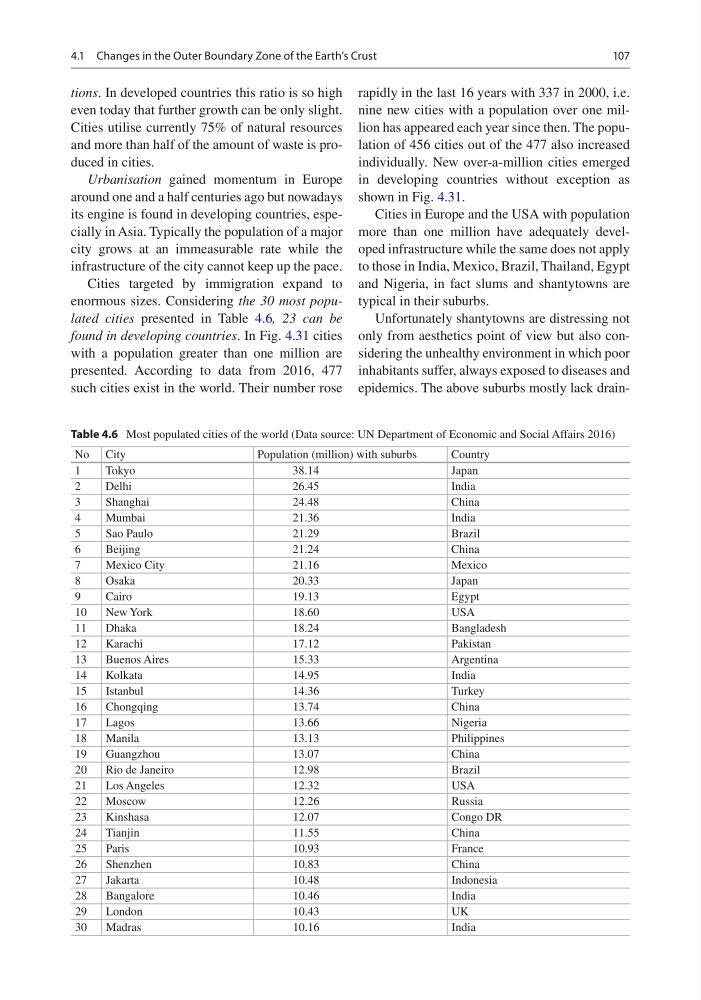
enormous sizes. Considering the 30 most populated cities presented in Table 4.6, 23 can be
found in developing countries. In Fig. 4.31 cities
with a population greater than one million are
presented. According to data from 2016, 477
such cities exist in the world. Their number rose
rapidly in the last 16 years with 337 in 2000, i.e.
nine new cities with a population over one million has appeared each year since then. The population of 456 cities out of the 477 also increased
individually. New over-a-million cities emerged
in developing countries without exception as
shown in Fig. 4.31.
Cities in Europe and the USA with population
more than one million have adequately developed infrastructure while the same does not apply
to those in India, Mexico, Brazil, Thailand, Egypt
and Nigeria, in fact slums and shantytowns are
typical in their suburbs.
Unfortunately shantytowns are distressing not
only from aesthetics point of view but also considering the unhealthy environment in which poor
inhabitants suffer, always exposed to diseases and
epidemics. The above suburbs mostly lack drainTable 4.6 Most populated cities of the world (Data source: UN Department of Economic and Social Affairs 2016)
No City
Population (million) with suburbs
Country
1
Tokyo
38.14
Japan
2
Delhi
26.45
India
3
Shanghai
24.48
China
4
Mumbai
21.36
India
5
Sao Paulo
21.29
Brazil
6
Beijing
21.24
China
7
Mexico City
21.16
Mexico
8
Osaka
20.33
Japan
9
Cairo
19.13
Egypt
10
New York
18.60
USA
11
Dhaka
18.24
Bangladesh
12
Karachi
17.12
Pakistan
13
Buenos Aires
15.33
Argentina
14
Kolkata
14.95
India
15
Istanbul
14.36
Turkey
16
Chongqing
13.74
China
17
Lagos
13.66
Nigeria
18
Manila
13.13
Philippines
19
Guangzhou
13.07
China
20
Rio de Janeiro
12.98
Brazil
21
Los Angeles
12.32
USA
22
Moscow
12.26
Russia
23
Kinshasa
12.07
Congo DR
24
Tianjin
11.55
China
25
Paris
10.93
France
26
Shenzhen
10.83
China
27
Jakarta
10.48
Indonesia
28
Bangalore
10.46
India
29
London
10.43
UK
30
Madras
10.16
India
4.1 Changes in the Outer Boundary Zone of the Earth’s Crust
tions. In developed countries this ratio is so high
even today that further growth can be only slight.
Cities utilise currently 75% of natural resources
and more than half of the amount of waste is produced in cities.
Urbanisation gained momentum in Europe
around one and a half centuries ago but nowadays
its engine is found in developing countries, especially in Asia. Typically the population of a major
city grows at an immeasurable rate while the
infrastructure of the city cannot keep up the pace.
Cities targeted by immigration expand to
enormous sizes. Considering the 30 most populated cities presented in Table 4.6, 23 can be
found in developing countries. In Fig. 4.31 cities
with a population greater than one million are
presented. According to data from 2016, 477
such cities exist in the world. Their number rose
rapidly in the last 16 years with 337 in 2000, i.e.
nine new cities with a population over one million has appeared each year since then. The population of 456 cities out of the 477 also increased
individually. New over-a-million cities emerged
in developing countries without exception as
shown in Fig. 4.31.
Cities in Europe and the USA with population
more than one million have adequately developed infrastructure while the same does not apply
to those in India, Mexico, Brazil, Thailand, Egypt
and Nigeria, in fact slums and shantytowns are
typical in their suburbs.
Unfortunately shantytowns are distressing not
only from aesthetics point of view but also considering the unhealthy environment in which poor
inhabitants suffer, always exposed to diseases and
epidemics. The above suburbs mostly lack drainTable 4.6 Most populated cities of the world (Data source: UN Department of Economic and Social Affairs 2016)
No City
Population (million) with suburbs
Country
1
Tokyo
38.14
Japan
2
Delhi
26.45
India
3
Shanghai
24.48
China
4
Mumbai
21.36
India
5
Sao Paulo
21.29
Brazil
6
Beijing
21.24
China
7
Mexico City
21.16
Mexico
8
Osaka
20.33
Japan
9
Cairo
19.13
Egypt
10
New York
18.60
USA
11
Dhaka
18.24
Bangladesh
12
Karachi
17.12
Pakistan
13
Buenos Aires
15.33
Argentina
14
Kolkata
14.95
India
15
Istanbul
14.36
Turkey
16
Chongqing
13.74
China
17
Lagos
13.66
Nigeria
18
Manila
13.13
Philippines
19
Guangzhou
13.07
China
20
Rio de Janeiro
12.98
Brazil
21
Los Angeles
12.32
USA
22
Moscow
12.26
Russia
23
Kinshasa
12.07
Congo DR
24
Tianjin
11.55
China
25
Paris
10.93
France
26
Shenzhen
10.83
China
27
Jakarta
10.48
Indonesia
28
Bangalore
10.46
India
29
London
10.43
UK
30
Madras
10.16
India
4.1 Changes in the Outer Boundary Zone of the Earth’s Crust