

99
Table 4.5 Land area modified by human action (Source: Hooke et al. 2012)
Activity
Area involved 10
6
km
2
% of Earth’s land surface
Human modified land
Cropland (mostly cultivated or ploughed land)
16.7 ± 2.4
12.8 ± 1.8
Permanent meadows and pastures
33.5 ± 5.7
25.8 ± 4.3
Land area modified by deposition of eroded sediment
5.3 ± 2.0
4.1 ± 1.5
Land area modified by logging
2.4 ± 1.2
1.8 ± 0.9
Plantation forestry area
2.7
2.1
Sub-total agriculture and forestry
60.6 ± 6.5
46.6 ± 5.0
Urban areas (including urban roads)
3.7 ± 1.0
2.8 ± 0.8
Rural housing and commercial developments
4.2 ± 1.4
3.2 ± 1.1
Motorways and roads in rural areas
0.5 ± 0.1
0.4 ± 0.1
Reservoirs
0.2 ± 0.1
0.2 ± 0.1
Railways
0.03
0.02
Mining and quarrying
0.4 + 0.4/−0.1
0.3 + 0.3/−0.1
Sub-total human infrastructure
9.0 ± 1.7
6.92+/−1.3
Total land area modified by humans
69.6 ± 6.7
53.5 ± 5.1
Natural lands (mostly)
Forest area (natural, if not necessarily virgin)
36.2 ± 2.9
27.8 ± 2.2
Other land (mainly high mountains, tundra, deserts, etc.) 24.3
18.7
Total natural land area
60.5
46.5
Total land area (excluding ice sheets)
130.1
100.0
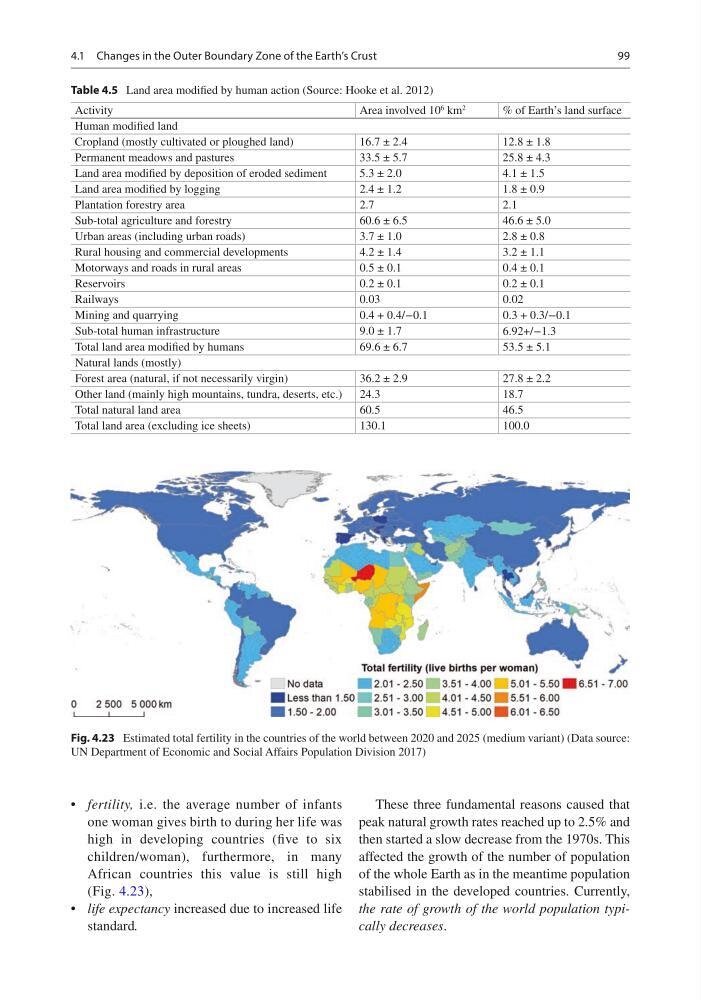
Fig. 4.23 Estimated total fertility in the countries of the world between 2020 and 2025 (medium variant) (Data source:
UN Department of Economic and Social Affairs Population Division 2017)
• fertility, i.e. the average number of infants
one woman gives birth to during her life was
high in developing countries (five to six
children/woman), furthermore, in many
African countries this value is still high
(Fig. 4.23),
• life expectancy increased due to increased life
standard.
These three fundamental reasons caused that
peak natural growth rates reached up to 2.5% and
then started a slow decrease from the 1970s. This
affected the growth of the number of population
of the whole Earth as in the meantime population
stabilised in the developed countries. Currently,
the rate of growth of the world population typically decreases.
4.1 Changes in the Outer Boundary Zone of the Earth’s Crust
Table 4.5 Land area modified by human action (Source: Hooke et al. 2012)
Activity
Area involved 10
6
km
2
% of Earth’s land surface
Human modified land
Cropland (mostly cultivated or ploughed land)
16.7 ± 2.4
12.8 ± 1.8
Permanent meadows and pastures
33.5 ± 5.7
25.8 ± 4.3
Land area modified by deposition of eroded sediment
5.3 ± 2.0
4.1 ± 1.5
Land area modified by logging
2.4 ± 1.2
1.8 ± 0.9
Plantation forestry area
2.7
2.1
Sub-total agriculture and forestry
60.6 ± 6.5
46.6 ± 5.0
Urban areas (including urban roads)
3.7 ± 1.0
2.8 ± 0.8
Rural housing and commercial developments
4.2 ± 1.4
3.2 ± 1.1
Motorways and roads in rural areas
0.5 ± 0.1
0.4 ± 0.1
Reservoirs
0.2 ± 0.1
0.2 ± 0.1
Railways
0.03
0.02
Mining and quarrying
0.4 + 0.4/−0.1
0.3 + 0.3/−0.1
Sub-total human infrastructure
9.0 ± 1.7
6.92+/−1.3
Total land area modified by humans
69.6 ± 6.7
53.5 ± 5.1
Natural lands (mostly)
Forest area (natural, if not necessarily virgin)
36.2 ± 2.9
27.8 ± 2.2
Other land (mainly high mountains, tundra, deserts, etc.) 24.3
18.7
Total natural land area
60.5
46.5
Total land area (excluding ice sheets)
130.1
100.0
Fig. 4.23 Estimated total fertility in the countries of the world between 2020 and 2025 (medium variant) (Data source:
UN Department of Economic and Social Affairs Population Division 2017)
• fertility, i.e. the average number of infants
one woman gives birth to during her life was
high in developing countries (five to six
children/woman), furthermore, in many
African countries this value is still high
(Fig. 4.23),
• life expectancy increased due to increased life
standard.
These three fundamental reasons caused that
peak natural growth rates reached up to 2.5% and
then started a slow decrease from the 1970s. This
affected the growth of the number of population
of the whole Earth as in the meantime population
stabilised in the developed countries. Currently,
the rate of growth of the world population typically decreases.
4.1 Changes in the Outer Boundary Zone of the Earth’s Crust