

426 Modern Food Microbiology
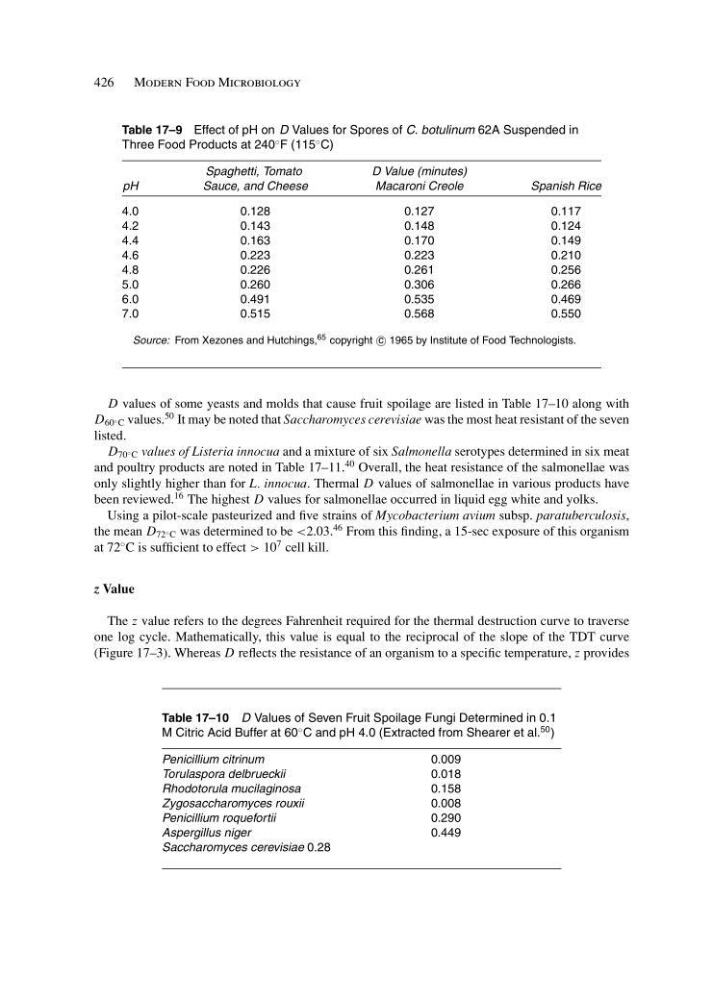
Table 17–9 Effect of pH on D Values for Spores of C. botulinum 62A Suspended in
Three Food Products at 240
◦ F (115
◦ C)
Spaghetti, Tomato
D Value (minutes)
pH
Sauce, and Cheese
Macaroni Creole
Spanish Rice
4.0
0.128
0.127
0.117
4.2
0.143
0.148
0.124
4.4
0.163
0.170
0.149
4.6
0.223
0.223
0.210
4.8
0.226
0.261
0.256
5.0
0.260
0.306
0.266
6.0
0.491
0.535
0.469
7.0
0.515
0.568
0.550
Source: From Xezones and Hutchings, 65 copyright c
1965 by Institute of Food Technologists.
D values of some yeasts and molds that cause fruit spoilage are listed in Table 17–10 along with
D 60 ◦ C values.
50 It may be noted that Saccharomyces cerevisiae was the most heat resistant of the seven
listed.
D 70 ◦ C values of Listeria innocua and a mixture of six Salmonella serotypes determined in six meat
and poultry products are noted in Table 17–11.
40 Overall, the heat resistance of the salmonellae was
only slightly higher than for L. innocua. Thermal D values of salmonellae in various products have
been reviewed.
16 The highest D values for salmonellae occurred in liquid egg white and yolks.
Using a pilot-scale pasteurized and five strains of Mycobacterium avium subsp. paratuberculosis,
the mean D 72 ◦ C was determined to be <2.03.
46 From this finding, a 15-sec exposure of this organism
at 72
◦ C is sufficient to effect > 10
7 cell kill.
z Value
The z value refers to the degrees Fahrenheit required for the thermal destruction curve to traverse
one log cycle. Mathematically, this value is equal to the reciprocal of the slope of the TDT curve
(Figure 17–3). Whereas D reflects the resistance of an organism to a specific temperature, z provides
Table 17–10 D Values of Seven Fruit Spoilage Fungi Determined in 0.1
M Citric Acid Buffer at 60
◦ C and pH 4.0 (Extracted from Shearer et al.
50 )
Penicillium citrinum
0.009
Torulaspora delbrueckii
0.018
Rhodotorula mucilaginosa
0.158
Zygosaccharomyces rouxii
0.008
Penicillium roquefortii
0.290
Aspergillus niger
0.449
Saccharomyces cerevisiae 0.28
Table 17–9 Effect of pH on D Values for Spores of C. botulinum 62A Suspended in
Three Food Products at 240
◦ F (115
◦ C)
Spaghetti, Tomato
D Value (minutes)
pH
Sauce, and Cheese
Macaroni Creole
Spanish Rice
4.0
0.128
0.127
0.117
4.2
0.143
0.148
0.124
4.4
0.163
0.170
0.149
4.6
0.223
0.223
0.210
4.8
0.226
0.261
0.256
5.0
0.260
0.306
0.266
6.0
0.491
0.535
0.469
7.0
0.515
0.568
0.550
Source: From Xezones and Hutchings, 65 copyright c
1965 by Institute of Food Technologists.
D values of some yeasts and molds that cause fruit spoilage are listed in Table 17–10 along with
D 60 ◦ C values.
50 It may be noted that Saccharomyces cerevisiae was the most heat resistant of the seven
listed.
D 70 ◦ C values of Listeria innocua and a mixture of six Salmonella serotypes determined in six meat
and poultry products are noted in Table 17–11.
40 Overall, the heat resistance of the salmonellae was
only slightly higher than for L. innocua. Thermal D values of salmonellae in various products have
been reviewed.
16 The highest D values for salmonellae occurred in liquid egg white and yolks.
Using a pilot-scale pasteurized and five strains of Mycobacterium avium subsp. paratuberculosis,
the mean D 72 ◦ C was determined to be <2.03.
46 From this finding, a 15-sec exposure of this organism
at 72
◦ C is sufficient to effect > 10
7 cell kill.
z Value
The z value refers to the degrees Fahrenheit required for the thermal destruction curve to traverse
one log cycle. Mathematically, this value is equal to the reciprocal of the slope of the TDT curve
(Figure 17–3). Whereas D reflects the resistance of an organism to a specific temperature, z provides
Table 17–10 D Values of Seven Fruit Spoilage Fungi Determined in 0.1
M Citric Acid Buffer at 60
◦ C and pH 4.0 (Extracted from Shearer et al.
50 )
Penicillium citrinum
0.009
Torulaspora delbrueckii
0.018
Rhodotorula mucilaginosa
0.158
Zygosaccharomyces rouxii
0.008
Penicillium roquefortii
0.290
Aspergillus niger
0.449
Saccharomyces cerevisiae 0.28