

400 Modern Food Microbiology
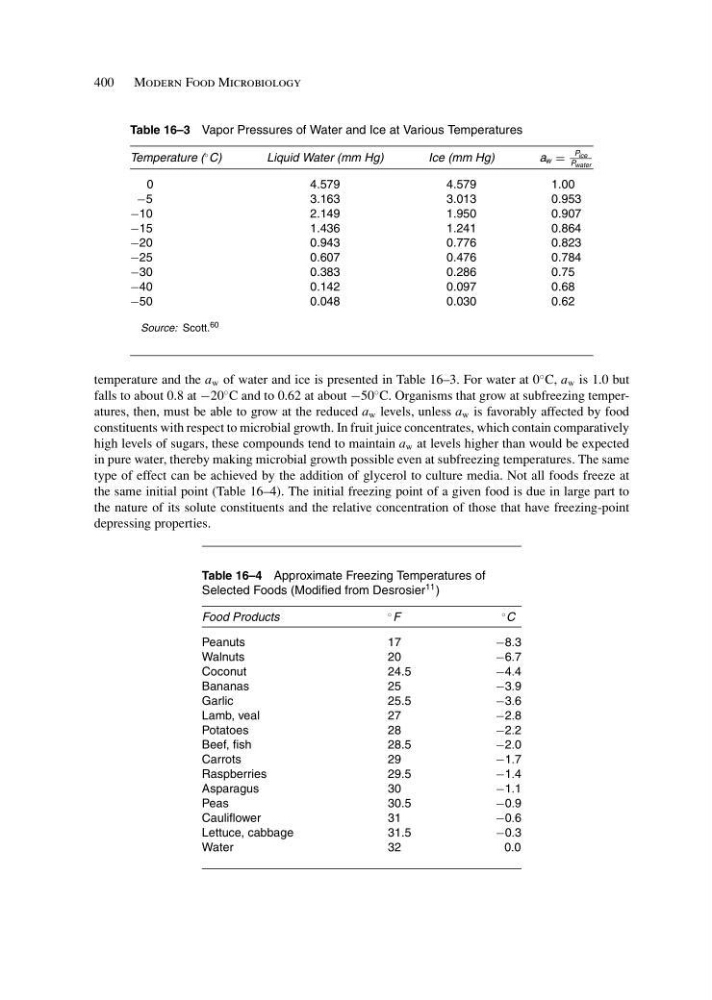
Table 16–3 Vapor Pressures of Water and Ice at Various Temperatures
Temperature (
◦ C)
Liquid Water (mm Hg)
Ice (mm Hg)
a w =
P ice
P water
0
4.579
4.579
1.00
−5
3.163
3.013
0.953
−10
2.149
1.950
0.907
−15
1.436
1.241
0.864
−20
0.943
0.776
0.823
−25
0.607
0.476
0.784
−30
0.383
0.286
0.75
−40
0.142
0.097
0.68
−50
0.048
0.030
0.62
Source: Scott. 60
temperature and the a w of water and ice is presented in Table 16–3. For water at 0
◦ C, a w is 1.0 but
falls to about 0.8 at −20
◦ C and to 0.62 at about −50
◦ C. Organisms that grow at subfreezing temperatures, then, must be able to grow at the reduced a w levels, unless a w is favorably affected by food
constituents with respect to microbial growth. In fruit juice concentrates, which contain comparatively
high levels of sugars, these compounds tend to maintain a w at levels higher than would be expected
in pure water, thereby making microbial growth possible even at subfreezing temperatures. The same
type of effect can be achieved by the addition of glycerol to culture media. Not all foods freeze at
the same initial point (Table 16–4). The initial freezing point of a given food is due in large part to
the nature of its solute constituents and the relative concentration of those that have freezing-point
depressing properties.
Table 16–4 Approximate Freezing Temperatures of
Selected Foods (Modified from Desrosier
11 )
Food Products
◦ F
◦ C
Peanuts
17
−8.3
Walnuts
20
−6.7
Coconut
24.5
−4.4
Bananas
25
−3.9
Garlic
25.5
−3.6
Lamb, veal
27
−2.8
Potatoes
28
−2.2
Beef, fish
28.5
−2.0
Carrots
29
−1.7
Raspberries
29.5
−1.4
Asparagus
30
−1.1
Peas
30.5
−0.9
Cauliflower
31
−0.6
Lettuce, cabbage
31.5
−0.3
Water
32
0.0
Table 16–3 Vapor Pressures of Water and Ice at Various Temperatures
Temperature (
◦ C)
Liquid Water (mm Hg)
Ice (mm Hg)
a w =
P ice
P water
0
4.579
4.579
1.00
−5
3.163
3.013
0.953
−10
2.149
1.950
0.907
−15
1.436
1.241
0.864
−20
0.943
0.776
0.823
−25
0.607
0.476
0.784
−30
0.383
0.286
0.75
−40
0.142
0.097
0.68
−50
0.048
0.030
0.62
Source: Scott. 60
temperature and the a w of water and ice is presented in Table 16–3. For water at 0
◦ C, a w is 1.0 but
falls to about 0.8 at −20
◦ C and to 0.62 at about −50
◦ C. Organisms that grow at subfreezing temperatures, then, must be able to grow at the reduced a w levels, unless a w is favorably affected by food
constituents with respect to microbial growth. In fruit juice concentrates, which contain comparatively
high levels of sugars, these compounds tend to maintain a w at levels higher than would be expected
in pure water, thereby making microbial growth possible even at subfreezing temperatures. The same
type of effect can be achieved by the addition of glycerol to culture media. Not all foods freeze at
the same initial point (Table 16–4). The initial freezing point of a given food is due in large part to
the nature of its solute constituents and the relative concentration of those that have freezing-point
depressing properties.
Table 16–4 Approximate Freezing Temperatures of
Selected Foods (Modified from Desrosier
11 )
Food Products
◦ F
◦ C
Peanuts
17
−8.3
Walnuts
20
−6.7
Coconut
24.5
−4.4
Bananas
25
−3.9
Garlic
25.5
−3.6
Lamb, veal
27
−2.8
Potatoes
28
−2.2
Beef, fish
28.5
−2.0
Carrots
29
−1.7
Raspberries
29.5
−1.4
Asparagus
30
−1.1
Peas
30.5
−0.9
Cauliflower
31
−0.6
Lettuce, cabbage
31.5
−0.3
Water
32
0.0