

Vegetable and Fruit Products
127
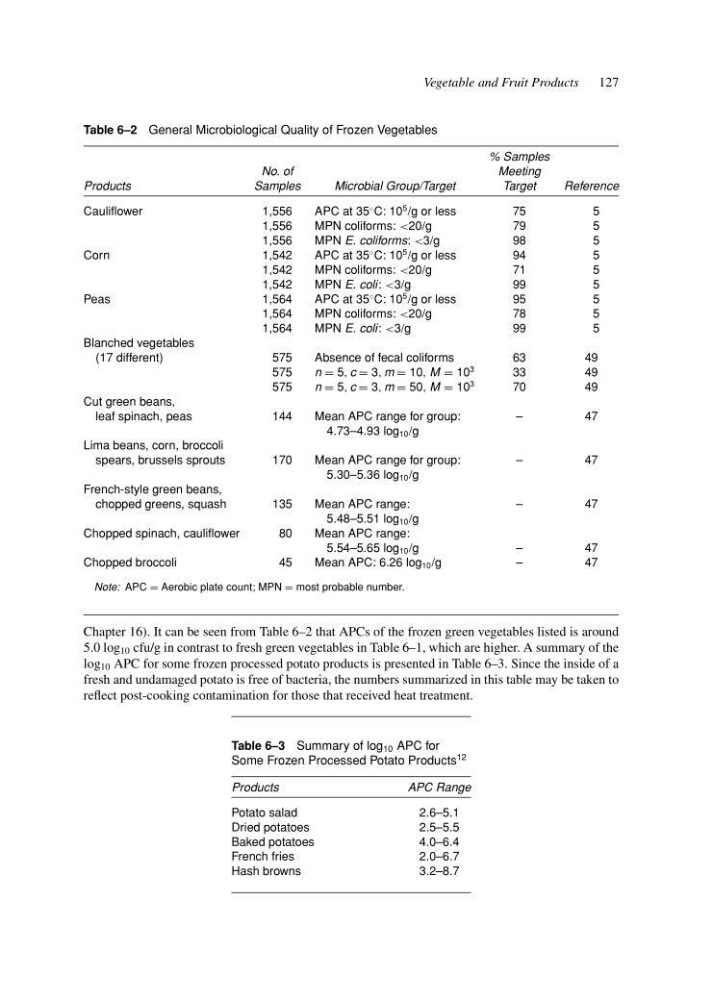
Table 6–2 General Microbiological Quality of Frozen Vegetables
% Samples
No. of
Meeting
Products
Samples
Microbial Group/Target
Target
Reference
Cauliflower
1,556
APC at 35
◦ C: 10
5 /g or less
75
5
1,556
MPN coliforms: <20/g
79
5
1,556
MPN E. coliforms: <3/g
98
5
Corn
1,542
APC at 35
◦ C: 10
5 /g or less
94
5
1,542
MPN coliforms: <20/g
71
5
1,542
MPN E. coli: <3/g
99
5
Peas
1,564
APC at 35
◦ C: 10
5 /g or less
95
5
1,564
MPN coliforms: <20/g
78
5
1,564
MPN E. coli: <3/g
99
5
Blanched vegetables
(17 different)
575
Absence of fecal coliforms
63
49
575
n = 5, c = 3, m = 10, M = 10
3
33
49
575
n = 5, c = 3, m = 50, M = 10
3
70
49
Cut green beans,
leaf spinach, peas
144
Mean APC range for group:
–
47
4.73–4.93 log 10 /g
Lima beans, corn, broccoli
spears, brussels sprouts
170
Mean APC range for group:
–
47
5.30–5.36 log 10 /g
French-style green beans,
chopped greens, squash
135
Mean APC range:
–
47
5.48–5.51 log 10 /g
Chopped spinach, cauliflower
80
Mean APC range:
5.54–5.65 log 10 /g
–
47
Chopped broccoli
45
Mean APC: 6.26 log 10 /g
–
47
Note: APC = Aerobic plate count; MPN = most probable number.
Chapter 16). It can be seen from Table 6–2 that APCs of the frozen green vegetables listed is around
5.0 log 10 cfu/g in contrast to fresh green vegetables in Table 6–1, which are higher. A summary of the
log 10 APC for some frozen processed potato products is presented in Table 6–3. Since the inside of a
fresh and undamaged potato is free of bacteria, the numbers summarized in this table may be taken to
reflect post-cooking contamination for those that received heat treatment.
Table 6–3 Summary of log 10 APC for
Some Frozen Processed Potato Products
12
Products
APC Range
Potato salad
2.6–5.1
Dried potatoes
2.5–5.5
Baked potatoes
4.0–6.4
French fries
2.0–6.7
Hash browns
3.2–8.7
127
Table 6–2 General Microbiological Quality of Frozen Vegetables
% Samples
No. of
Meeting
Products
Samples
Microbial Group/Target
Target
Reference
Cauliflower
1,556
APC at 35
◦ C: 10
5 /g or less
75
5
1,556
MPN coliforms: <20/g
79
5
1,556
MPN E. coliforms: <3/g
98
5
Corn
1,542
APC at 35
◦ C: 10
5 /g or less
94
5
1,542
MPN coliforms: <20/g
71
5
1,542
MPN E. coli: <3/g
99
5
Peas
1,564
APC at 35
◦ C: 10
5 /g or less
95
5
1,564
MPN coliforms: <20/g
78
5
1,564
MPN E. coli: <3/g
99
5
Blanched vegetables
(17 different)
575
Absence of fecal coliforms
63
49
575
n = 5, c = 3, m = 10, M = 10
3
33
49
575
n = 5, c = 3, m = 50, M = 10
3
70
49
Cut green beans,
leaf spinach, peas
144
Mean APC range for group:
–
47
4.73–4.93 log 10 /g
Lima beans, corn, broccoli
spears, brussels sprouts
170
Mean APC range for group:
–
47
5.30–5.36 log 10 /g
French-style green beans,
chopped greens, squash
135
Mean APC range:
–
47
5.48–5.51 log 10 /g
Chopped spinach, cauliflower
80
Mean APC range:
5.54–5.65 log 10 /g
–
47
Chopped broccoli
45
Mean APC: 6.26 log 10 /g
–
47
Note: APC = Aerobic plate count; MPN = most probable number.
Chapter 16). It can be seen from Table 6–2 that APCs of the frozen green vegetables listed is around
5.0 log 10 cfu/g in contrast to fresh green vegetables in Table 6–1, which are higher. A summary of the
log 10 APC for some frozen processed potato products is presented in Table 6–3. Since the inside of a
fresh and undamaged potato is free of bacteria, the numbers summarized in this table may be taken to
reflect post-cooking contamination for those that received heat treatment.
Table 6–3 Summary of log 10 APC for
Some Frozen Processed Potato Products
12
Products
APC Range
Potato salad
2.6–5.1
Dried potatoes
2.5–5.5
Baked potatoes
4.0–6.4
French fries
2.0–6.7
Hash browns
3.2–8.7