

80
A. Geethakarthi
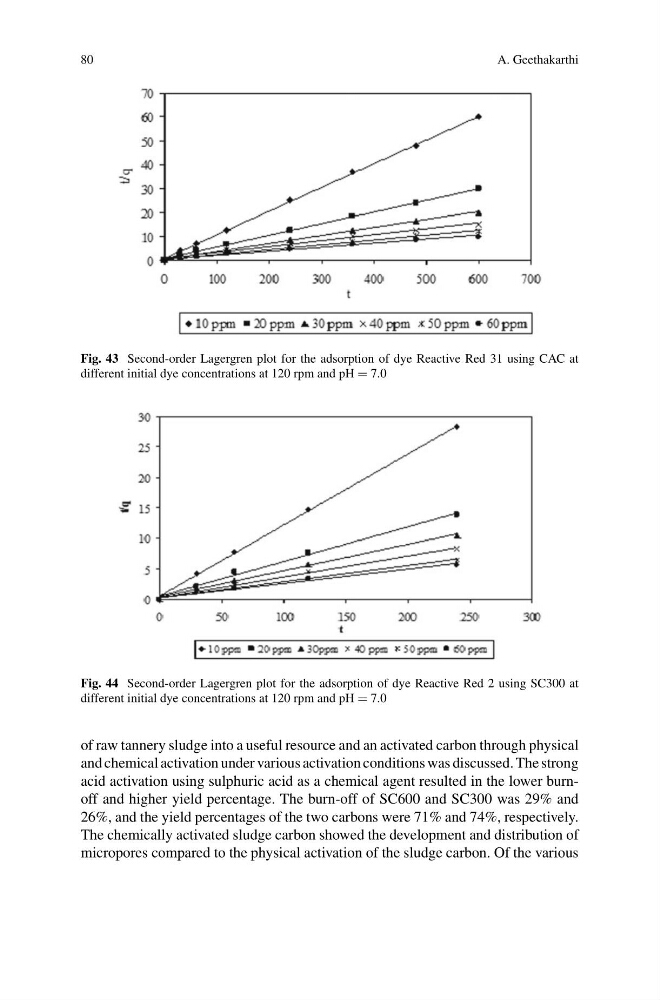
Fig. 43 Second-order Lagergren plot for the adsorption of dye Reactive Red 31 using CAC at
different initial dye concentrations at 120 rpm and pH = 7.0
Fig. 44 Second-order Lagergren plot for the adsorption of dye Reactive Red 2 using SC300 at
different initial dye concentrations at 120 rpm and pH = 7.0
of raw tannery sludge into a useful resource and an activated carbon through physical
and chemical activation under various activation conditions was discussed. The strong
acid activation using sulphuric acid as a chemical agent resulted in the lower burnoff and higher yield percentage. The burn-off of SC600 and SC300 was 29% and
26%, and the yield percentages of the two carbons were 71% and 74%, respectively.
The chemically activated sludge carbon showed the development and distribution of
micropores compared to the physical activation of the sludge carbon. Of the various
A. Geethakarthi
Fig. 43 Second-order Lagergren plot for the adsorption of dye Reactive Red 31 using CAC at
different initial dye concentrations at 120 rpm and pH = 7.0
Fig. 44 Second-order Lagergren plot for the adsorption of dye Reactive Red 2 using SC300 at
different initial dye concentrations at 120 rpm and pH = 7.0
of raw tannery sludge into a useful resource and an activated carbon through physical
and chemical activation under various activation conditions was discussed. The strong
acid activation using sulphuric acid as a chemical agent resulted in the lower burnoff and higher yield percentage. The burn-off of SC600 and SC300 was 29% and
26%, and the yield percentages of the two carbons were 71% and 74%, respectively.
The chemically activated sludge carbon showed the development and distribution of
micropores compared to the physical activation of the sludge carbon. Of the various