

78
A. Geethakarthi
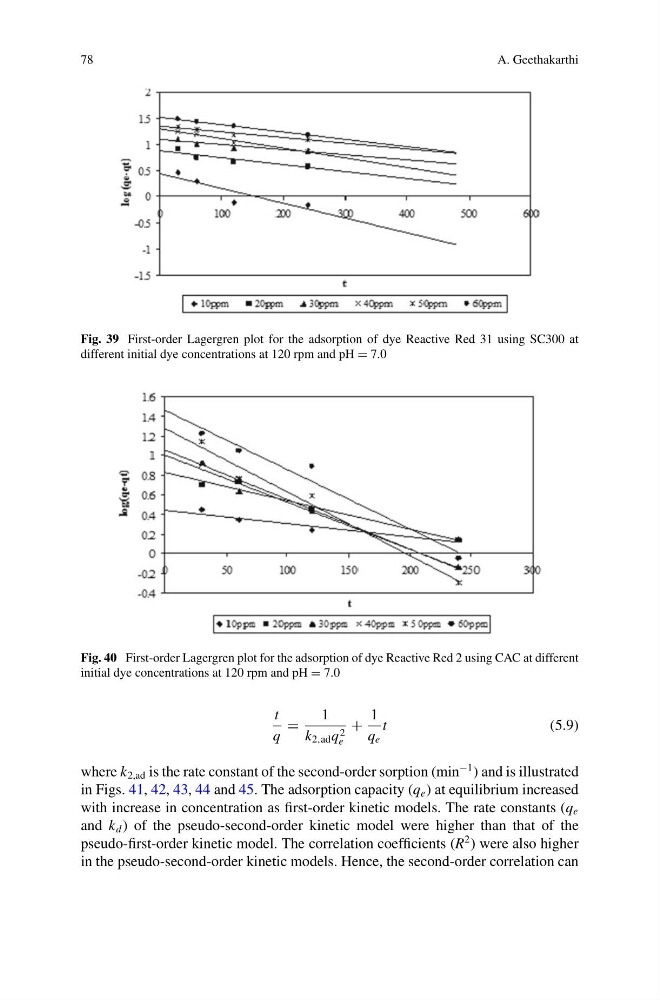
Fig. 39 First-order Lagergren plot for the adsorption of dye Reactive Red 31 using SC300 at
different initial dye concentrations at 120 rpm and pH = 7.0
Fig. 40 First-order Lagergren plot for the adsorption of dye Reactive Red 2 using CAC at different
initial dye concentrations at 120 rpm and pH = 7.0
t
q
=
1
k 2,ad q 2
e
+
1
q e
t
(5.9)
where k 2,ad is the rate constant of the second-order sorption (min
−1 ) and is illustrated
in Figs. 41, 42, 43, 44 and 45. The adsorption capacity (q e ) at equilibrium increased
with increase in concentration as first-order kinetic models. The rate constants (q e
and k d ) of the pseudo-second-order kinetic model were higher than that of the
pseudo-first-order kinetic model. The correlation coefficients (R
2 ) were also higher
in the pseudo-second-order kinetic models. Hence, the second-order correlation can
A. Geethakarthi
Fig. 39 First-order Lagergren plot for the adsorption of dye Reactive Red 31 using SC300 at
different initial dye concentrations at 120 rpm and pH = 7.0
Fig. 40 First-order Lagergren plot for the adsorption of dye Reactive Red 2 using CAC at different
initial dye concentrations at 120 rpm and pH = 7.0
t
q
=
1
k 2,ad q 2
e
+
1
q e
t
(5.9)
where k 2,ad is the rate constant of the second-order sorption (min
−1 ) and is illustrated
in Figs. 41, 42, 43, 44 and 45. The adsorption capacity (q e ) at equilibrium increased
with increase in concentration as first-order kinetic models. The rate constants (q e
and k d ) of the pseudo-second-order kinetic model were higher than that of the
pseudo-first-order kinetic model. The correlation coefficients (R
2 ) were also higher
in the pseudo-second-order kinetic models. Hence, the second-order correlation can