

164
M. Parthiban and G. Devanand
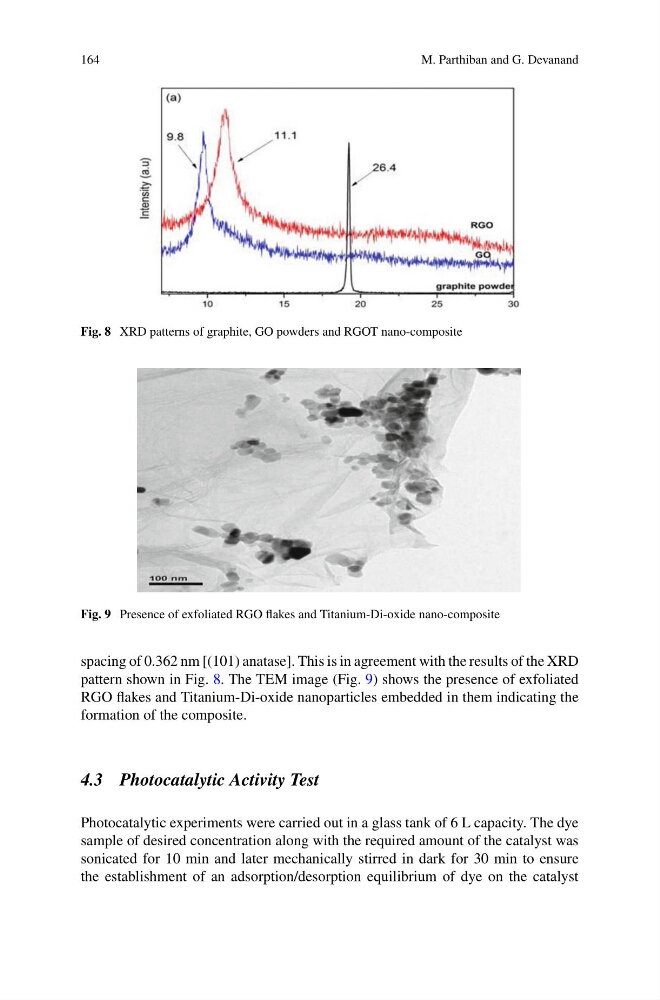
Fig. 8 XRD patterns of graphite, GO powders and RGOT nano-composite
Fig. 9 Presence of exfoliated RGO flakes and Titanium-Di-oxide nano-composite
spacing of 0.362 nm [(101) anatase]. This is in agreement with the results of the XRD
pattern shown in Fig. 8. The TEM image (Fig. 9) shows the presence of exfoliated
RGO flakes and Titanium-Di-oxide nanoparticles embedded in them indicating the
formation of the composite.
4.3 Photocatalytic Activity Test
Photocatalytic experiments were carried out in a glass tank of 6 L capacity. The dye
sample of desired concentration along with the required amount of the catalyst was
sonicated for 10 min and later mechanically stirred in dark for 30 min to ensure
the establishment of an adsorption/desorption equilibrium of dye on the catalyst
M. Parthiban and G. Devanand
Fig. 8 XRD patterns of graphite, GO powders and RGOT nano-composite
Fig. 9 Presence of exfoliated RGO flakes and Titanium-Di-oxide nano-composite
spacing of 0.362 nm [(101) anatase]. This is in agreement with the results of the XRD
pattern shown in Fig. 8. The TEM image (Fig. 9) shows the presence of exfoliated
RGO flakes and Titanium-Di-oxide nanoparticles embedded in them indicating the
formation of the composite.
4.3 Photocatalytic Activity Test
Photocatalytic experiments were carried out in a glass tank of 6 L capacity. The dye
sample of desired concentration along with the required amount of the catalyst was
sonicated for 10 min and later mechanically stirred in dark for 30 min to ensure
the establishment of an adsorption/desorption equilibrium of dye on the catalyst