

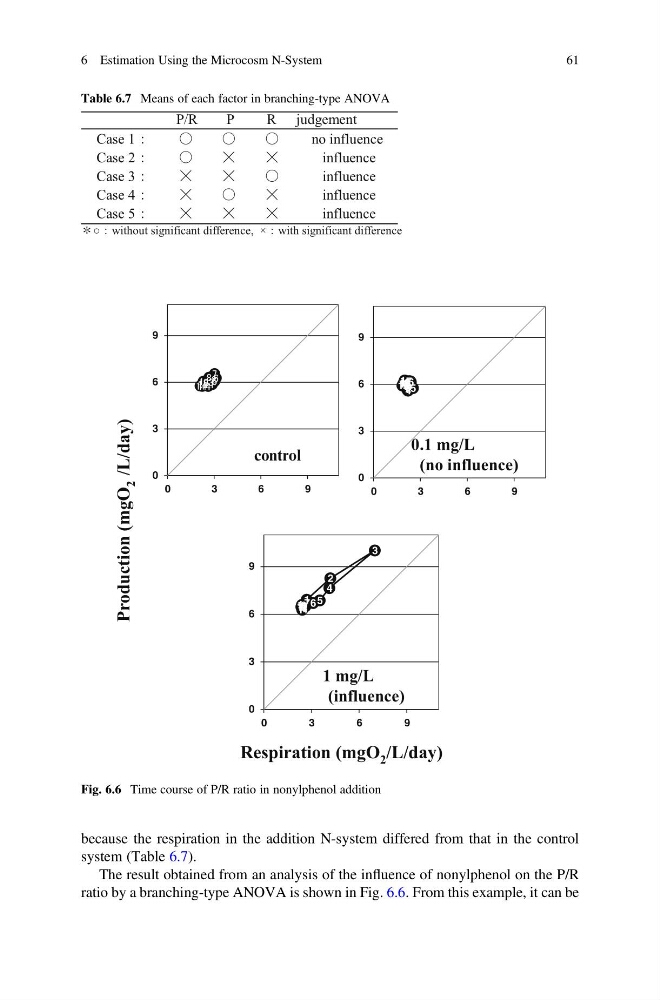
because the respiration in the addition N-system differed from that in the control
system (Table 6.7).
The result obtained from an analysis of the influence of nonylphenol on the P/R
ratio by a branching-type ANOVA is shown in Fig. 6.6. From this example, it can be
Table 6.7 Means of each factor in branching-type ANOVA
P/R
P
R judgement
Case 1㸸
ࠐ
ࠐ
ࠐ
no influence
Case 2㸸
ࠐ
܉
܉
influence
Case 3㸸
܉
܉
ࠐ
influence
Case 4㸸
܉
ࠐ
܉
influence
Case 5㸸
܉
܉
܉
influence
㸨○㸸without significant difference, ×㸸with significant difference
0
3
6
9
0
3
6
9
1 2
3 4 5
6
7
8 9
10
11
12 13 14
0
3
6
9
0
3
6
9
1
2
3
4
5
6
7
8
9
10
11
12 13
14
0
3
6
9
0
3
6
9
control
Production (mgO
2 /L/day)
Respiration (mgO 2 /L/day)
0.1 mg/L
(no influence)
1 mg/L
(influence)
Fig. 6.6 Time course of P/R ratio in nonylphenol addition
6 Estimation Using the Microcosm N-System
61
system (Table 6.7).
The result obtained from an analysis of the influence of nonylphenol on the P/R
ratio by a branching-type ANOVA is shown in Fig. 6.6. From this example, it can be
Table 6.7 Means of each factor in branching-type ANOVA
P/R
P
R judgement
Case 1㸸
ࠐ
ࠐ
ࠐ
no influence
Case 2㸸
ࠐ
܉
܉
influence
Case 3㸸
܉
܉
ࠐ
influence
Case 4㸸
܉
ࠐ
܉
influence
Case 5㸸
܉
܉
܉
influence
㸨○㸸without significant difference, ×㸸with significant difference
0
3
6
9
0
3
6
9
1 2
3 4 5
6
7
8 9
10
11
12 13 14
0
3
6
9
0
3
6
9
1
2
3
4
5
6
7
8
9
10
11
12 13
14
0
3
6
9
0
3
6
9
control
Production (mgO
2 /L/day)
Respiration (mgO 2 /L/day)
0.1 mg/L
(no influence)
1 mg/L
(influence)
Fig. 6.6 Time course of P/R ratio in nonylphenol addition
6 Estimation Using the Microcosm N-System
61