

(4) F A Â C ¼ 0.00368 / 0.00465 ¼ 0.79.
– Procedure (6): Fix a level of significance for α ¼ 0.05 and calculate the F-statistic
corresponding to each degree of freedom.
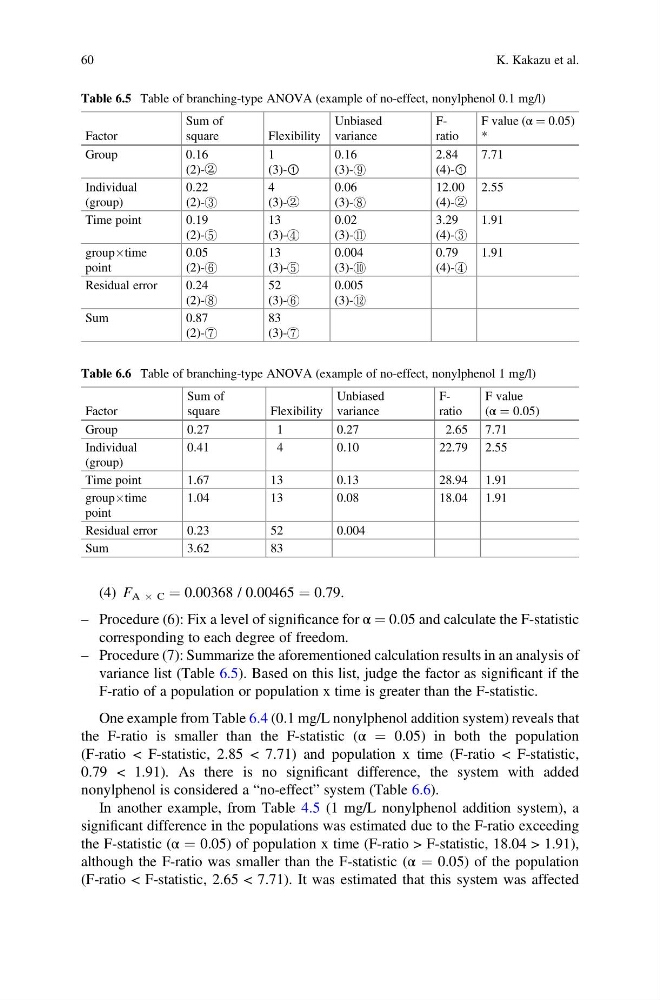
– Procedure (7): Summarize the aforementioned calculation results in an analysis of
variance list (Table 6.5). Based on this list, judge the factor as significant if the
F-ratio of a population or population x time is greater than the F-statistic.
One example from Table 6.4 (0.1 mg/L nonylphenol addition system) reveals that
the F-ratio is smaller than the F-statistic (α ¼ 0.05) in both the population
(F-ratio < F-statistic, 2.85 < 7.71) and population x time (F-ratio < F-statistic,
0.79 < 1.91). As there is no significant difference, the system with added
nonylphenol is considered a “no-effect” system (Table 6.6).
In another example, from Table 4.5 (1 mg/L nonylphenol addition system), a
significant difference in the populations was estimated due to the F-ratio exceeding
the F-statistic (α ¼ 0.05) of population x time (F-ratio > F-statistic, 18.04 > 1.91),
although the F-ratio was smaller than the F-statistic (α ¼ 0.05) of the population
(F-ratio < F-statistic, 2.65 < 7.71). It was estimated that this system was affected
Table 6.5 Table of branching-type ANOVA (example of no-effect, nonylphenol 0.1 mg/l)
Factor
Sum of
square
Flexibility
Unbiased
variance
Fratio
F value (α ¼ 0.05)
*
Group
0.16
(2)-②
1
(3)-①
0.16
(3)-⑨
2.84
(4)-①
7.71
Individual
(group)
0.22
(2)-③
4
(3)-②
0.06
(3)-⑧
12.00
(4)-②
2.55
Time point
0.19
(2)-⑤
13
(3)-④
0.02
(3)-⑪
3.29
(4)-③
1.91
groupÂtime
point
0.05
(2)-⑥
13
(3)-⑤
0.004
(3)-⑩
0.79
(4)-④
1.91
Residual error
0.24
(2)-⑧
52
(3)-⑥
0.005
(3)-⑫
Sum
0.87
(2)-⑦
83
(3)-⑦
Table 6.6 Table of branching-type ANOVA (example of no-effect, nonylphenol 1 mg/l)
Factor
Sum of
square
Flexibility
Unbiased
variance
Fratio
F value
(α ¼ 0.05)
Group
0.27
1
0.27
2.65 7.71
Individual
(group)
0.41
4
0.10
22.79 2.55
Time point
1.67
13
0.13
28.94 1.91
groupÂtime
point
1.04
13
0.08
18.04 1.91
Residual error
0.23
52
0.004
Sum
3.62
83
60
K. Kakazu et al.
– Procedure (6): Fix a level of significance for α ¼ 0.05 and calculate the F-statistic
corresponding to each degree of freedom.
– Procedure (7): Summarize the aforementioned calculation results in an analysis of
variance list (Table 6.5). Based on this list, judge the factor as significant if the
F-ratio of a population or population x time is greater than the F-statistic.
One example from Table 6.4 (0.1 mg/L nonylphenol addition system) reveals that
the F-ratio is smaller than the F-statistic (α ¼ 0.05) in both the population
(F-ratio < F-statistic, 2.85 < 7.71) and population x time (F-ratio < F-statistic,
0.79 < 1.91). As there is no significant difference, the system with added
nonylphenol is considered a “no-effect” system (Table 6.6).
In another example, from Table 4.5 (1 mg/L nonylphenol addition system), a
significant difference in the populations was estimated due to the F-ratio exceeding
the F-statistic (α ¼ 0.05) of population x time (F-ratio > F-statistic, 18.04 > 1.91),
although the F-ratio was smaller than the F-statistic (α ¼ 0.05) of the population
(F-ratio < F-statistic, 2.65 < 7.71). It was estimated that this system was affected
Table 6.5 Table of branching-type ANOVA (example of no-effect, nonylphenol 0.1 mg/l)
Factor
Sum of
square
Flexibility
Unbiased
variance
Fratio
F value (α ¼ 0.05)
*
Group
0.16
(2)-②
1
(3)-①
0.16
(3)-⑨
2.84
(4)-①
7.71
Individual
(group)
0.22
(2)-③
4
(3)-②
0.06
(3)-⑧
12.00
(4)-②
2.55
Time point
0.19
(2)-⑤
13
(3)-④
0.02
(3)-⑪
3.29
(4)-③
1.91
groupÂtime
point
0.05
(2)-⑥
13
(3)-⑤
0.004
(3)-⑩
0.79
(4)-④
1.91
Residual error
0.24
(2)-⑧
52
(3)-⑥
0.005
(3)-⑫
Sum
0.87
(2)-⑦
83
(3)-⑦
Table 6.6 Table of branching-type ANOVA (example of no-effect, nonylphenol 1 mg/l)
Factor
Sum of
square
Flexibility
Unbiased
variance
Fratio
F value
(α ¼ 0.05)
Group
0.27
1
0.27
2.65 7.71
Individual
(group)
0.41
4
0.10
22.79 2.55
Time point
1.67
13
0.13
28.94 1.91
groupÂtime
point
1.04
13
0.08
18.04 1.91
Residual error
0.23
52
0.004
Sum
3.62
83
60
K. Kakazu et al.