

understood that there was no ecological influence from nonylphenol on the microcosm N-system, based on the lack of a significant difference at 0.1 mg/L of added
nonylphenol. However, there was an influence at 1 mg/L of added nonylphenol, as
shown by the significant difference in the population.
6.3.3 Use of Microsoft Excel for Analyzing the Microcosm
N-System
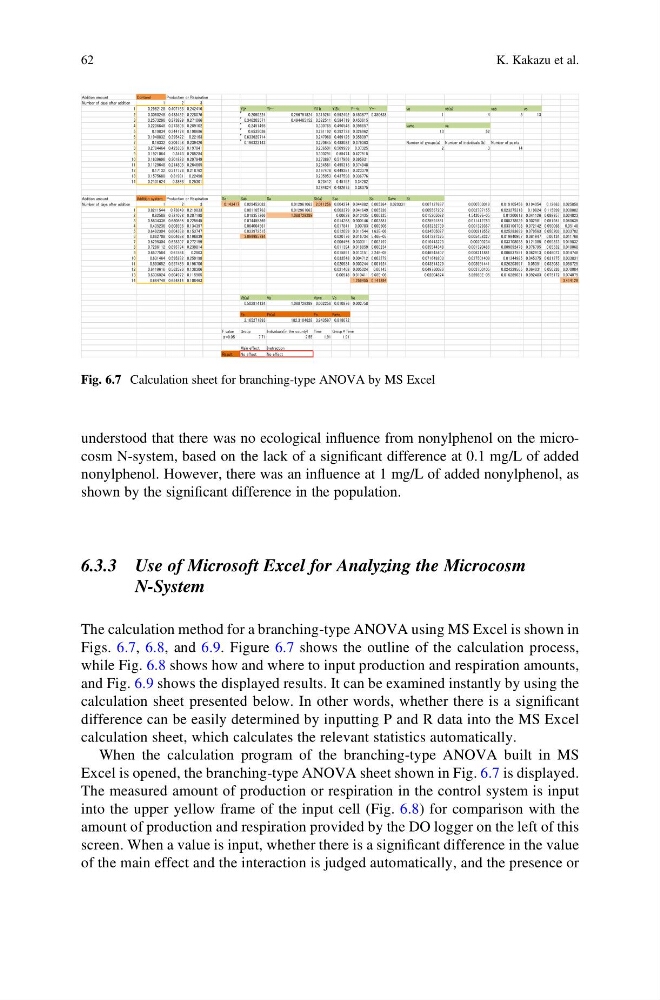
The calculation method for a branching-type ANOVA using MS Excel is shown in
Figs. 6.7, 6.8, and 6.9. Figure 6.7 shows the outline of the calculation process,
while Fig. 6.8 shows how and where to input production and respiration amounts,
and Fig. 6.9 shows the displayed results. It can be examined instantly by using the
calculation sheet presented below. In other words, whether there is a significant
difference can be easily determined by inputting P and R data into the MS Excel
calculation sheet, which calculates the relevant statistics automatically.
When the calculation program of the branching-type ANOVA built in MS
Excel is opened, the branching-type ANOVA sheet shown in Fig. 6.7 is displayed.
The measured amount of production or respiration in the control system is input
into the upper yellow frame of the input cell (Fig. 6.8) for comparison with the
amount of production and respiration provided by the DO logger on the left of this
screen. When a value is input, whether there is a significant difference in the value
of the main effect and the interaction is judged automatically, and the presence or
㼅㼕㼖䞉
㼅㼕䞉䞉
㼅㼕㻝䡇
㼅㼕㻞䡇
㼅䞉䞉䡇
㼅䈈
㻳㼞㼛㼡㼜㽢㼀㼕㼙㼑
䃐㻩㻜㻚㻜㻡
Fig. 6.7 Calculation sheet for branching-type ANOVA by MS Excel
62
K. Kakazu et al.
nonylphenol. However, there was an influence at 1 mg/L of added nonylphenol, as
shown by the significant difference in the population.
6.3.3 Use of Microsoft Excel for Analyzing the Microcosm
N-System
The calculation method for a branching-type ANOVA using MS Excel is shown in
Figs. 6.7, 6.8, and 6.9. Figure 6.7 shows the outline of the calculation process,
while Fig. 6.8 shows how and where to input production and respiration amounts,
and Fig. 6.9 shows the displayed results. It can be examined instantly by using the
calculation sheet presented below. In other words, whether there is a significant
difference can be easily determined by inputting P and R data into the MS Excel
calculation sheet, which calculates the relevant statistics automatically.
When the calculation program of the branching-type ANOVA built in MS
Excel is opened, the branching-type ANOVA sheet shown in Fig. 6.7 is displayed.
The measured amount of production or respiration in the control system is input
into the upper yellow frame of the input cell (Fig. 6.8) for comparison with the
amount of production and respiration provided by the DO logger on the left of this
screen. When a value is input, whether there is a significant difference in the value
of the main effect and the interaction is judged automatically, and the presence or
㼅㼕㼖䞉
㼅㼕䞉䞉
㼅㼕㻝䡇
㼅㼕㻞䡇
㼅䞉䞉䡇
㼅䈈
㻳㼞㼛㼡㼜㽢㼀㼕㼙㼑
䃐㻩㻜㻚㻜㻡
Fig. 6.7 Calculation sheet for branching-type ANOVA by MS Excel
62
K. Kakazu et al.