

that it is lower (in the case of nitrogen). Leave the flask undisturbed for ~60 min
without closing the cap. Then, replace the oxygen or nitrogen of the vapor phase in
the flask with air, and measure the DO for 24–48 h, as described in Sect. 4.2.3.
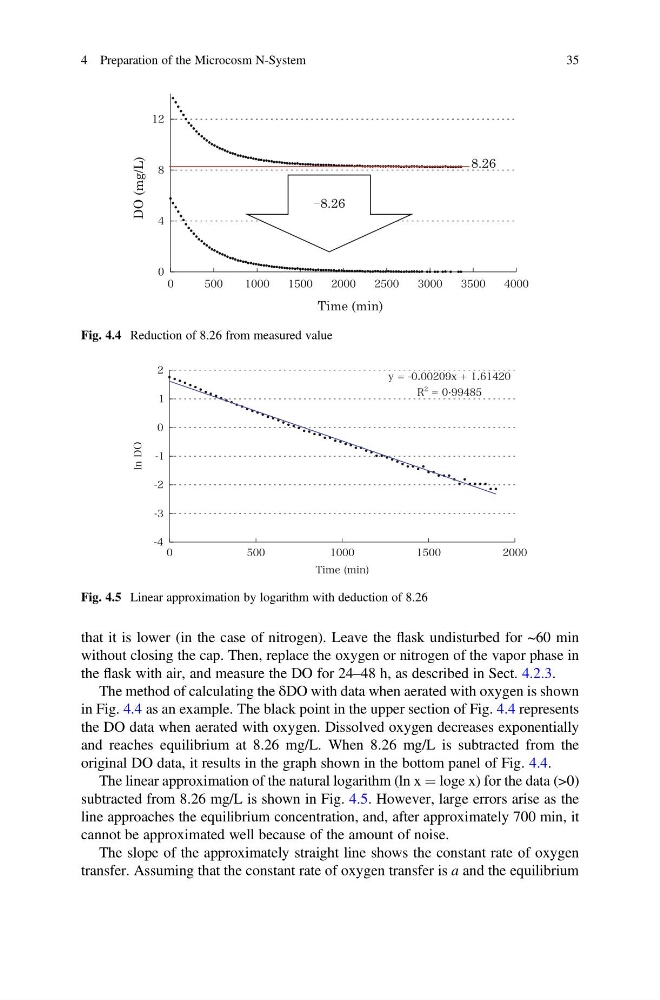
The method of calculating the δDO with data when aerated with oxygen is shown
in Fig. 4.4 as an example. The black point in the upper section of Fig. 4.4 represents
the DO data when aerated with oxygen. Dissolved oxygen decreases exponentially
and reaches equilibrium at 8.26 mg/L. When 8.26 mg/L is subtracted from the
original DO data, it results in the graph shown in the bottom panel of Fig. 4.4.
The linear approximation of the natural logarithm (ln x ¼ loge x) for the data (>0)
subtracted from 8.26 mg/L is shown in Fig. 4.5. However, large errors arise as the
line approaches the equilibrium concentration, and, after approximately 700 min, it
cannot be approximated well because of the amount of noise.
The slope of the approximately straight line shows the constant rate of oxygen
transfer. Assuming that the constant rate of oxygen transfer is a and the equilibrium
8.26
Ѹ8.26
Time (min)
DO (mg/L)
Fig. 4.4 Reduction of 8.26 from measured value
Fig. 4.5 Linear approximation by logarithm with deduction of 8.26
4 Preparation of the Microcosm N-System
35
without closing the cap. Then, replace the oxygen or nitrogen of the vapor phase in
the flask with air, and measure the DO for 24–48 h, as described in Sect. 4.2.3.
The method of calculating the δDO with data when aerated with oxygen is shown
in Fig. 4.4 as an example. The black point in the upper section of Fig. 4.4 represents
the DO data when aerated with oxygen. Dissolved oxygen decreases exponentially
and reaches equilibrium at 8.26 mg/L. When 8.26 mg/L is subtracted from the
original DO data, it results in the graph shown in the bottom panel of Fig. 4.4.
The linear approximation of the natural logarithm (ln x ¼ loge x) for the data (>0)
subtracted from 8.26 mg/L is shown in Fig. 4.5. However, large errors arise as the
line approaches the equilibrium concentration, and, after approximately 700 min, it
cannot be approximated well because of the amount of noise.
The slope of the approximately straight line shows the constant rate of oxygen
transfer. Assuming that the constant rate of oxygen transfer is a and the equilibrium
8.26
Ѹ8.26
Time (min)
DO (mg/L)
Fig. 4.4 Reduction of 8.26 from measured value
Fig. 4.5 Linear approximation by logarithm with deduction of 8.26
4 Preparation of the Microcosm N-System
35