

An Enhanced Data-Analyses Method for the Graphical …
575
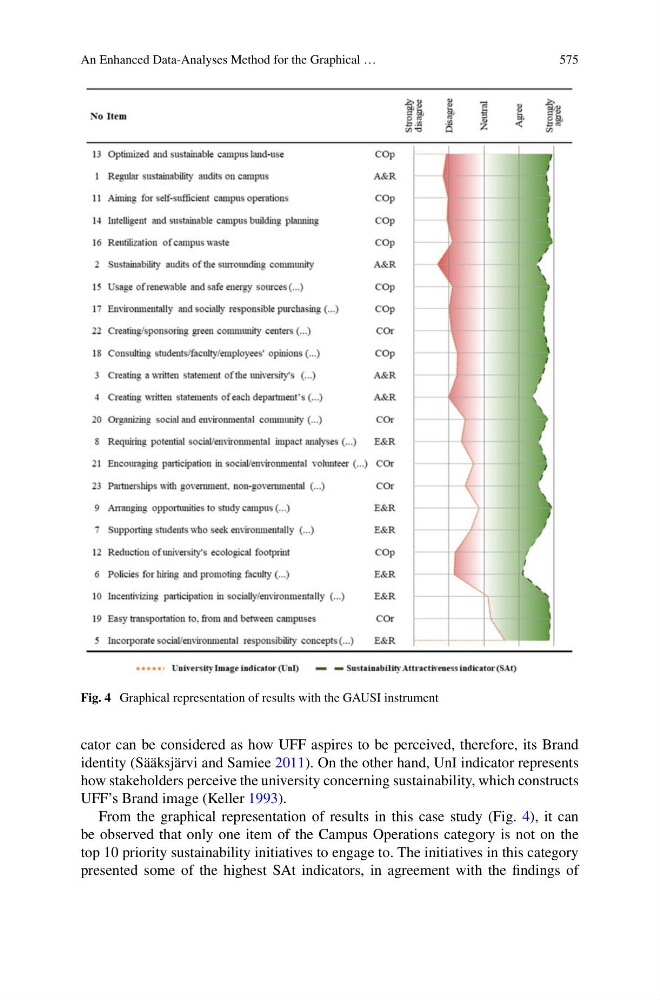
Fig. 4 Graphical representation of results with the GAUSI instrument
cator can be considered as how UFF aspires to be perceived, therefore, its Brand
identity (Sääksjärvi and Samiee 2011). On the other hand, UnI indicator represents
how stakeholders perceive the university concerning sustainability, which constructs
UFF’s Brand image (Keller 1993).
From the graphical representation of results in this case study (Fig. 4), it can
be observed that only one item of the Campus Operations category is not on the
top 10 priority sustainability initiatives to engage to. The initiatives in this category
presented some of the highest SAt indicators, in agreement with the findings of
575
Fig. 4 Graphical representation of results with the GAUSI instrument
cator can be considered as how UFF aspires to be perceived, therefore, its Brand
identity (Sääksjärvi and Samiee 2011). On the other hand, UnI indicator represents
how stakeholders perceive the university concerning sustainability, which constructs
UFF’s Brand image (Keller 1993).
From the graphical representation of results in this case study (Fig. 4), it can
be observed that only one item of the Campus Operations category is not on the
top 10 priority sustainability initiatives to engage to. The initiatives in this category
presented some of the highest SAt indicators, in agreement with the findings of