

Economic Complexity and the Environment: Evidence from Brazil
29
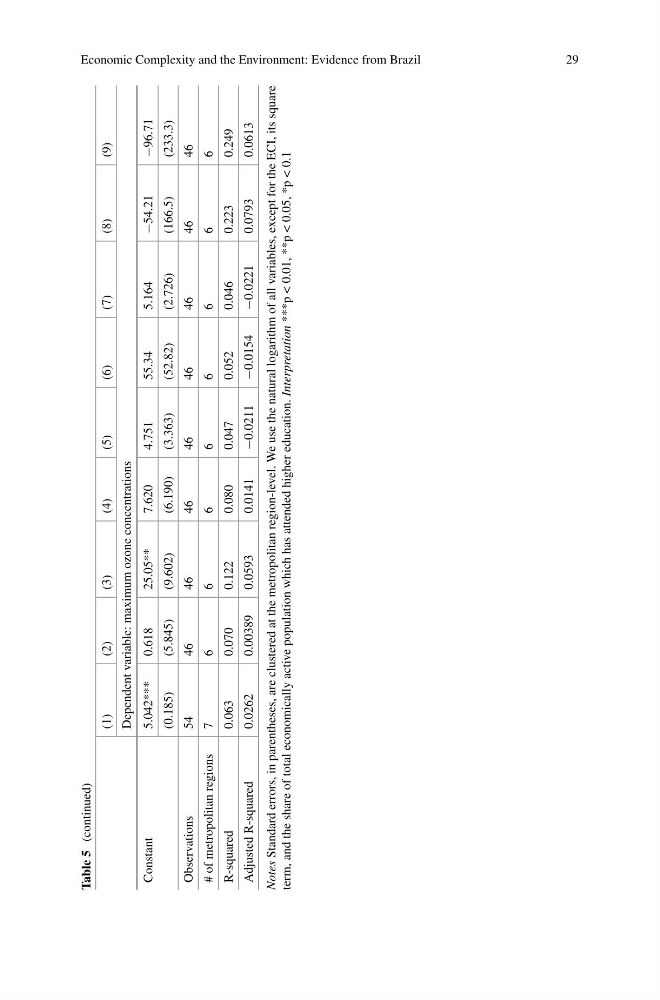
Table 5
(continued)
(1)
(2)
(3)
(4)
(5)
(6)
(7)
(8)
(9)
Dependent variable: maximum ozone concentrations
Constant
5.042***
0.618
25.05**
7.620
4.751
55.34
5.164
−54.21
−96.71
(0.185)
(5.845)
(9.602)
(6.190)
(3.363)
(52.82)
(2.726)
(166.5)
(233.3)
Observations
54
46
46
46
46
46
46
46
46
# of metropolitan regions
7
6
6
6
6
6
6
6
6
R-squared
0.063
0.070
0.122
0.080
0.047
0.052
0.046
0.223
0.249
Adjusted R-squared
0.0262
0.00389
0.0593
0.0141
−0.0211
−0.0154
−0.0221
0.0793
0.0613
Notes
Standard errors, in parentheses, are clustered at the metropolitan region-level. We use the natural logarithm of all variables, except for the ECI, its square
term, and the share of total economically active population which has attended higher education. Interpretation
***p < 0.01, **p < 0.05, *p < 0.1
29
Table 5
(continued)
(1)
(2)
(3)
(4)
(5)
(6)
(7)
(8)
(9)
Dependent variable: maximum ozone concentrations
Constant
5.042***
0.618
25.05**
7.620
4.751
55.34
5.164
−54.21
−96.71
(0.185)
(5.845)
(9.602)
(6.190)
(3.363)
(52.82)
(2.726)
(166.5)
(233.3)
Observations
54
46
46
46
46
46
46
46
46
# of metropolitan regions
7
6
6
6
6
6
6
6
6
R-squared
0.063
0.070
0.122
0.080
0.047
0.052
0.046
0.223
0.249
Adjusted R-squared
0.0262
0.00389
0.0593
0.0141
−0.0211
−0.0154
−0.0221
0.0793
0.0613
Notes
Standard errors, in parentheses, are clustered at the metropolitan region-level. We use the natural logarithm of all variables, except for the ECI, its square
term, and the share of total economically active population which has attended higher education. Interpretation
***p < 0.01, **p < 0.05, *p < 0.1