

65
in four regions, namely Lower Egypt (thirteen governorates), Middle Egypt (four
governorates), Upper Egypt (six governorates) and boarder governorates (four governorates, only two of them cultivate Egyptian clover).
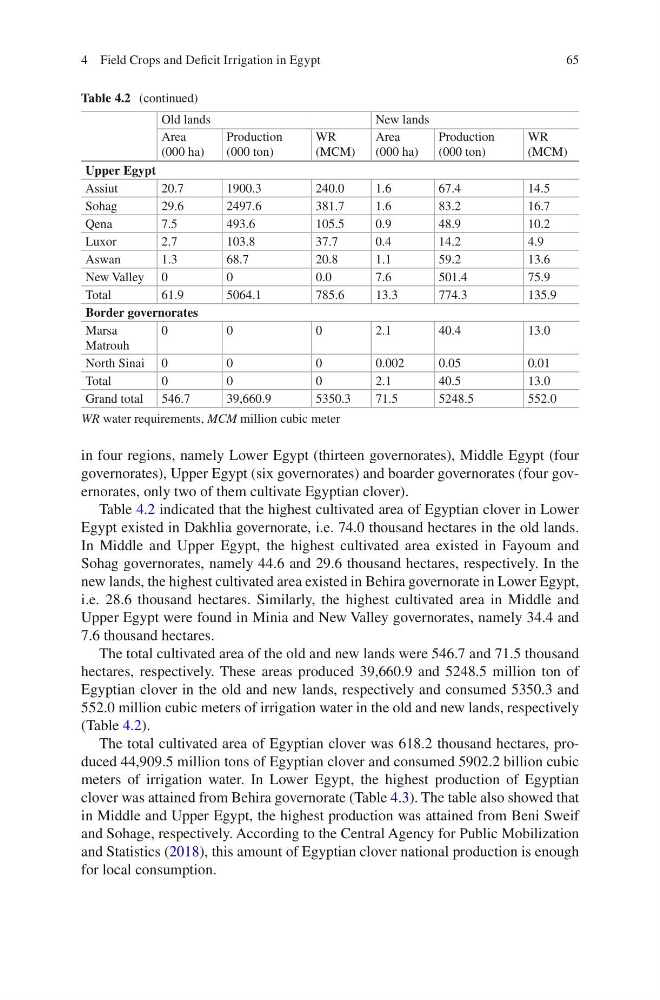
Table 4.2 indicated that the highest cultivated area of Egyptian clover in Lower
Egypt existed in Dakhlia governorate, i.e. 74.0 thousand hectares in the old lands.
In Middle and Upper Egypt, the highest cultivated area existed in Fayoum and
Sohag governorates, namely 44.6 and 29.6 thousand hectares, respectively. In the
new lands, the highest cultivated area existed in Behira governorate in Lower Egypt,
i.e. 28.6 thousand hectares. Similarly, the highest cultivated area in Middle and
Upper Egypt were found in Minia and New Valley governorates, namely 34.4 and
7.6 thousand hectares.
The total cultivated area of the old and new lands were 546.7 and 71.5 thousand
hectares, respectively. These areas produced 39,660.9 and 5248.5 million ton of
Egyptian clover in the old and new lands, respectively and consumed 5350.3 and
552.0 million cubic meters of irrigation water in the old and new lands, respectively
(Table 4.2).
The total cultivated area of Egyptian clover was 618.2 thousand hectares, produced 44,909.5 million tons of Egyptian clover and consumed 5902.2 billion cubic
meters of irrigation water. In Lower Egypt, the highest production of Egyptian
clover was attained from Behira governorate (Table 4.3). The table also showed that
in Middle and Upper Egypt, the highest production was attained from Beni Sweif
and Sohage, respectively. According to the Central Agency for Public Mobilization
and Statistics (2018), this amount of Egyptian clover national production is enough
for local consumption.
Table 4.2 (continued)
Old lands
New lands
Area
(000 ha)
Production
(000 ton)
WR
(MCM)
Area
(000 ha)
Production
(000 ton)
WR
(MCM)
Upper Egypt
Assiut
20.7
1900.3
240.0
1.6
67.4
14.5
Sohag
29.6
2497.6
381.7
1.6
83.2
16.7
Qena
7.5
493.6
105.5
0.9
48.9
10.2
Luxor
2.7
103.8
37.7
0.4
14.2
4.9
Aswan
1.3
68.7
20.8
1.1
59.2
13.6
New Valley 0
0
0.0
7.6
501.4
75.9
Total
61.9
5064.1
785.6
13.3
774.3
135.9
Border governorates
Marsa
Matrouh
0
0
0
2.1
40.4
13.0
North Sinai 0
0
0
0.002
0.05
0.01
Total
0
0
0
2.1
40.5
13.0
Grand total 546.7
39,660.9
5350.3
71.5
5248.5
552.0
WR water requirements, MCM million cubic meter
4 Field Crops and Deficit Irrigation in Egypt
in four regions, namely Lower Egypt (thirteen governorates), Middle Egypt (four
governorates), Upper Egypt (six governorates) and boarder governorates (four governorates, only two of them cultivate Egyptian clover).
Table 4.2 indicated that the highest cultivated area of Egyptian clover in Lower
Egypt existed in Dakhlia governorate, i.e. 74.0 thousand hectares in the old lands.
In Middle and Upper Egypt, the highest cultivated area existed in Fayoum and
Sohag governorates, namely 44.6 and 29.6 thousand hectares, respectively. In the
new lands, the highest cultivated area existed in Behira governorate in Lower Egypt,
i.e. 28.6 thousand hectares. Similarly, the highest cultivated area in Middle and
Upper Egypt were found in Minia and New Valley governorates, namely 34.4 and
7.6 thousand hectares.
The total cultivated area of the old and new lands were 546.7 and 71.5 thousand
hectares, respectively. These areas produced 39,660.9 and 5248.5 million ton of
Egyptian clover in the old and new lands, respectively and consumed 5350.3 and
552.0 million cubic meters of irrigation water in the old and new lands, respectively
(Table 4.2).
The total cultivated area of Egyptian clover was 618.2 thousand hectares, produced 44,909.5 million tons of Egyptian clover and consumed 5902.2 billion cubic
meters of irrigation water. In Lower Egypt, the highest production of Egyptian
clover was attained from Behira governorate (Table 4.3). The table also showed that
in Middle and Upper Egypt, the highest production was attained from Beni Sweif
and Sohage, respectively. According to the Central Agency for Public Mobilization
and Statistics (2018), this amount of Egyptian clover national production is enough
for local consumption.
Table 4.2 (continued)
Old lands
New lands
Area
(000 ha)
Production
(000 ton)
WR
(MCM)
Area
(000 ha)
Production
(000 ton)
WR
(MCM)
Upper Egypt
Assiut
20.7
1900.3
240.0
1.6
67.4
14.5
Sohag
29.6
2497.6
381.7
1.6
83.2
16.7
Qena
7.5
493.6
105.5
0.9
48.9
10.2
Luxor
2.7
103.8
37.7
0.4
14.2
4.9
Aswan
1.3
68.7
20.8
1.1
59.2
13.6
New Valley 0
0
0.0
7.6
501.4
75.9
Total
61.9
5064.1
785.6
13.3
774.3
135.9
Border governorates
Marsa
Matrouh
0
0
0
2.1
40.4
13.0
North Sinai 0
0
0
0.002
0.05
0.01
Total
0
0
0
2.1
40.5
13.0
Grand total 546.7
39,660.9
5350.3
71.5
5248.5
552.0
WR water requirements, MCM million cubic meter
4 Field Crops and Deficit Irrigation in Egypt