

The entire system was closed with a lid to prevent access to air for better simulation
of the anoxic underground environment.
In order to measure the physical and chemical parameters, a WTW Multi 3430
Multimeter with a Sentix®940, Sentix®900, and TetraCon® 925 sensor was used to
measure the pH, E h , and conductivity, respectively. The experiment was performed
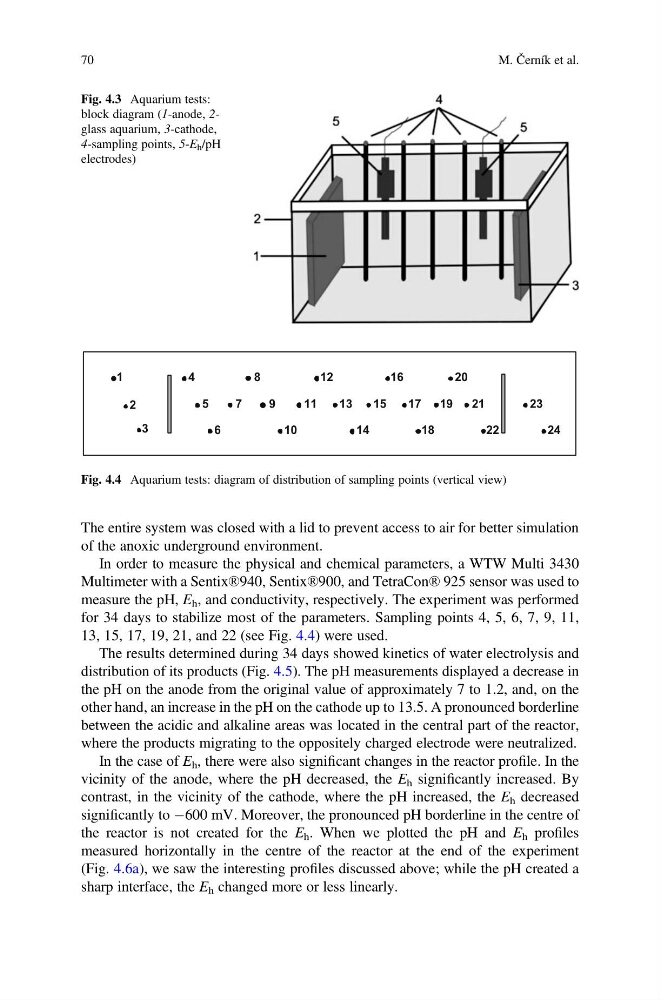
for 34 days to stabilize most of the parameters. Sampling points 4, 5, 6, 7, 9, 11,
13, 15, 17, 19, 21, and 22 (see Fig. 4.4) were used.
The results determined during 34 days showed kinetics of water electrolysis and
distribution of its products (Fig. 4.5). The pH measurements displayed a decrease in
the pH on the anode from the original value of approximately 7 to 1.2, and, on the
other hand, an increase in the pH on the cathode up to 13.5. A pronounced borderline
between the acidic and alkaline areas was located in the central part of the reactor,
where the products migrating to the oppositely charged electrode were neutralized.
In the case of E h , there were also significant changes in the reactor profile. In the
vicinity of the anode, where the pH decreased, the E h significantly increased. By
contrast, in the vicinity of the cathode, where the pH increased, the E h decreased
significantly to À600 mV. Moreover, the pronounced pH borderline in the centre of
the reactor is not created for the E h . When we plotted the pH and E h profiles
measured horizontally in the centre of the reactor at the end of the experiment
(Fig. 4.6a), we saw the interesting profiles discussed above; while the pH created a
sharp interface, the E h changed more or less linearly.
Fig. 4.3 Aquarium tests:
block diagram (1-anode, 2glass aquarium, 3-cathode,
4-sampling points, 5-E h /pH
electrodes)
3
6
1 0
1 4
1 8
1
4
8
1 2
1 6
2 0
22
2
5
7
9
11
13
15
17
19
21
23
24
Fig. 4.4 Aquarium tests: diagram of distribution of sampling points (vertical view)
70
M. Černík et al.
of the anoxic underground environment.
In order to measure the physical and chemical parameters, a WTW Multi 3430
Multimeter with a Sentix®940, Sentix®900, and TetraCon® 925 sensor was used to
measure the pH, E h , and conductivity, respectively. The experiment was performed
for 34 days to stabilize most of the parameters. Sampling points 4, 5, 6, 7, 9, 11,
13, 15, 17, 19, 21, and 22 (see Fig. 4.4) were used.
The results determined during 34 days showed kinetics of water electrolysis and
distribution of its products (Fig. 4.5). The pH measurements displayed a decrease in
the pH on the anode from the original value of approximately 7 to 1.2, and, on the
other hand, an increase in the pH on the cathode up to 13.5. A pronounced borderline
between the acidic and alkaline areas was located in the central part of the reactor,
where the products migrating to the oppositely charged electrode were neutralized.
In the case of E h , there were also significant changes in the reactor profile. In the
vicinity of the anode, where the pH decreased, the E h significantly increased. By
contrast, in the vicinity of the cathode, where the pH increased, the E h decreased
significantly to À600 mV. Moreover, the pronounced pH borderline in the centre of
the reactor is not created for the E h . When we plotted the pH and E h profiles
measured horizontally in the centre of the reactor at the end of the experiment
(Fig. 4.6a), we saw the interesting profiles discussed above; while the pH created a
sharp interface, the E h changed more or less linearly.
Fig. 4.3 Aquarium tests:
block diagram (1-anode, 2glass aquarium, 3-cathode,
4-sampling points, 5-E h /pH
electrodes)
3
6
1 0
1 4
1 8
1
4
8
1 2
1 6
2 0
22
2
5
7
9
11
13
15
17
19
21
23
24
Fig. 4.4 Aquarium tests: diagram of distribution of sampling points (vertical view)
70
M. Černík et al.