

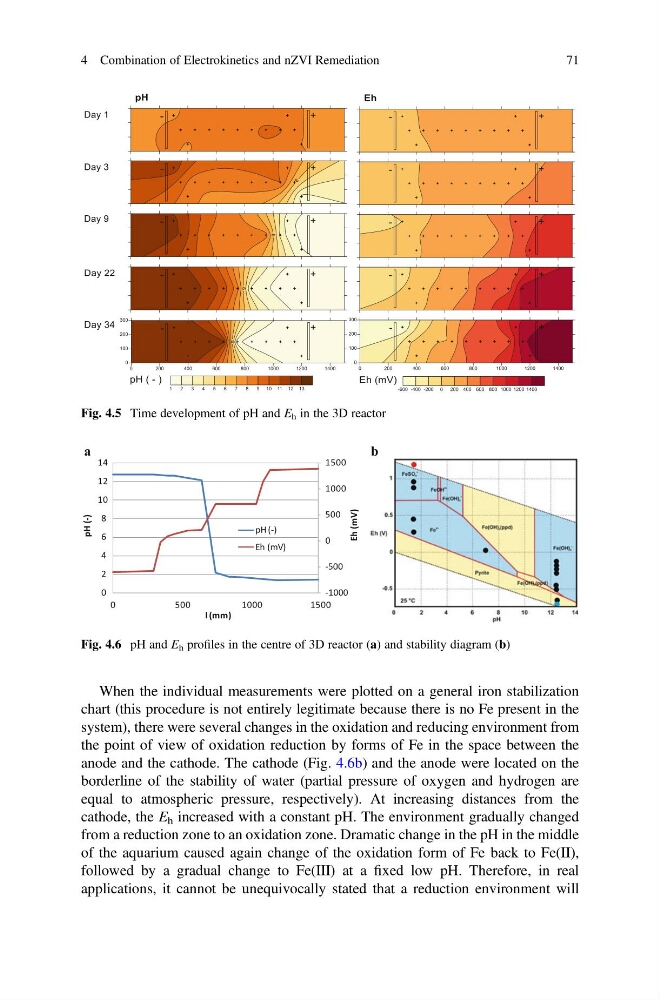
When the individual measurements were plotted on a general iron stabilization
chart (this procedure is not entirely legitimate because there is no Fe present in the
system), there were several changes in the oxidation and reducing environment from
the point of view of oxidation reduction by forms of Fe in the space between the
anode and the cathode. The cathode (Fig. 4.6b) and the anode were located on the
borderline of the stability of water (partial pressure of oxygen and hydrogen are
equal to atmospheric pressure, respectively). At increasing distances from the
cathode, the E h increased with a constant pH. The environment gradually changed
from a reduction zone to an oxidation zone. Dramatic change in the pH in the middle
of the aquarium caused again change of the oxidation form of Fe back to Fe(II),
followed by a gradual change to Fe(III) at a fixed low pH. Therefore, in real
applications, it cannot be unequivocally stated that a reduction environment will
Fig. 4.5 Time development of pH and E h in the 3D reactor
a
b
-1000
-500
0
500
1000
1500
0
2
4
6
8
10
12
14
0
500
1000
1500
Eh (mV)
pH (-)
l (mm)
pH (-)
Eh (mV)
Fig. 4.6 pH and E h profiles in the centre of 3D reactor (a) and stability diagram (b)
4 Combination of Electrokinetics and nZVI Remediation
71
chart (this procedure is not entirely legitimate because there is no Fe present in the
system), there were several changes in the oxidation and reducing environment from
the point of view of oxidation reduction by forms of Fe in the space between the
anode and the cathode. The cathode (Fig. 4.6b) and the anode were located on the
borderline of the stability of water (partial pressure of oxygen and hydrogen are
equal to atmospheric pressure, respectively). At increasing distances from the
cathode, the E h increased with a constant pH. The environment gradually changed
from a reduction zone to an oxidation zone. Dramatic change in the pH in the middle
of the aquarium caused again change of the oxidation form of Fe back to Fe(II),
followed by a gradual change to Fe(III) at a fixed low pH. Therefore, in real
applications, it cannot be unequivocally stated that a reduction environment will
Fig. 4.5 Time development of pH and E h in the 3D reactor
a
b
-1000
-500
0
500
1000
1500
0
2
4
6
8
10
12
14
0
500
1000
1500
Eh (mV)
pH (-)
l (mm)
pH (-)
Eh (mV)
Fig. 4.6 pH and E h profiles in the centre of 3D reactor (a) and stability diagram (b)
4 Combination of Electrokinetics and nZVI Remediation
71