

The obtained data are typically processed by summarization of groups of typical
fatty acids describing individual groups of microbes. The fungal biomass is usually
quantified on the basis of the 18:2ω6,9 content, which represents a eukaryotic fatty
acid; however, in case of the presence of other eukaryotic organisms, other fungal
chemical markers can be used, e.g., ergosterol (Baldrian et al. 2013). The total
bacterial biomass can be quantified as the sum of i14:0; i15:0; a15:0; 16:1ω9;
16:1ω7; 10Me-16:0; i17:0; a17:0; cy17:0; 17:0; 10Me-17:0; 10Me-18:0; and
cy19:0 fatty acids, Actinobacteria are determined on the basis of 10Me-17:0;
10Me-16:0; and 10Me-18:0, Gram-positive (G+) bacteria are quantified as the sum
of i14:0; i15:0; a15:0; i16:0; i17:0; and a17:0, and Gram-negative (G-) bacteria as
the sum of 16:1w7; 16:1w5; 18:1w7; cy19:0; and cy17:0 (Stella et al. 2015).
There are certain limitations regarding the interpretation of the results. The data
do not provide easily comprehensible picture about the biomass in comparison with,
e.g., the CFU. Moreover, the individual groups cannot be compared with one
another because various numbers of different fatty acids are used for the quantification. However, the data clearly show the changes in the individual populations, e.g.,
over the time or during the process of different types of decontamination actions.
Additionally, ratios of the individual groups are often used (e.g., fungi/bacteria).
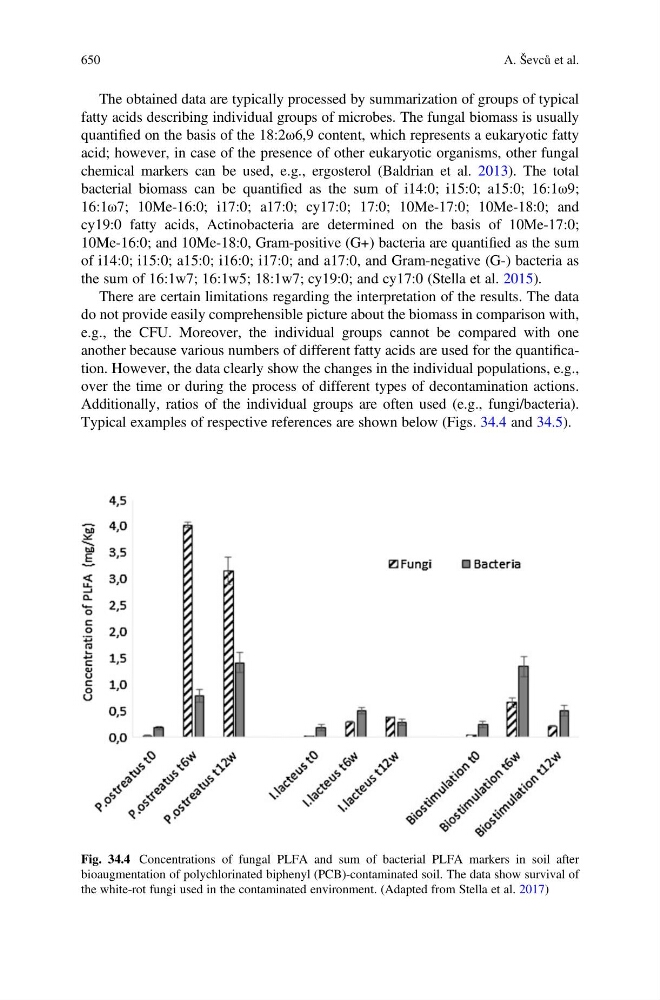
Typical examples of respective references are shown below (Figs. 34.4 and 34.5).
Fig. 34.4 Concentrations of fungal PLFA and sum of bacterial PLFA markers in soil after
bioaugmentation of polychlorinated biphenyl (PCB)-contaminated soil. The data show survival of
the white-rot fungi used in the contaminated environment. (Adapted from Stella et al. 2017)
650
A. Ševců et al.