

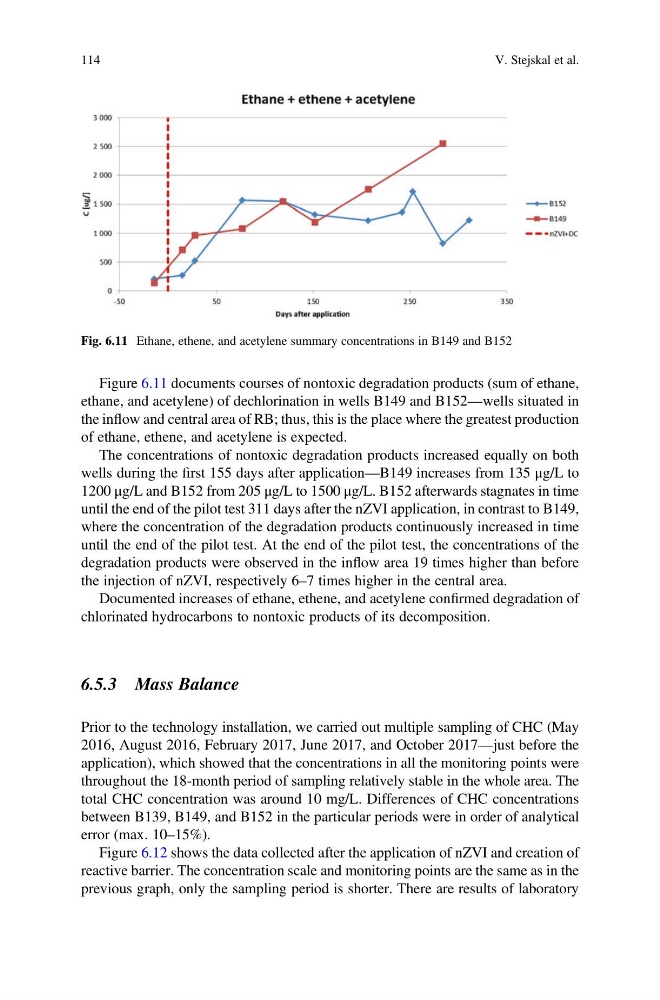
Figure 6.11 documents courses of nontoxic degradation products (sum of ethane,
ethane, and acetylene) of dechlorination in wells B149 and B152—wells situated in
the inflow and central area of RB; thus, this is the place where the greatest production
of ethane, ethene, and acetylene is expected.
The concentrations of nontoxic degradation products increased equally on both
wells during the first 155 days after application—B149 increases from 135 μg/L to
1200 μg/L and B152 from 205 μg/L to 1500 μg/L. B152 afterwards stagnates in time
until the end of the pilot test 311 days after the nZVI application, in contrast to B149,
where the concentration of the degradation products continuously increased in time
until the end of the pilot test. At the end of the pilot test, the concentrations of the
degradation products were observed in the inflow area 19 times higher than before
the injection of nZVI, respectively 6–7 times higher in the central area.
Documented increases of ethane, ethene, and acetylene confirmed degradation of
chlorinated hydrocarbons to nontoxic products of its decomposition.
6.5.3 Mass Balance
Prior to the technology installation, we carried out multiple sampling of CHC (May
2016, August 2016, February 2017, June 2017, and October 2017—just before the
application), which showed that the concentrations in all the monitoring points were
throughout the 18-month period of sampling relatively stable in the whole area. The
total CHC concentration was around 10 mg/L. Differences of CHC concentrations
between B139, B149, and B152 in the particular periods were in order of analytical
error (max. 10–15%).
Figure 6.12 shows the data collected after the application of nZVI and creation of
reactive barrier. The concentration scale and monitoring points are the same as in the
previous graph, only the sampling period is shorter. There are results of laboratory
Fig. 6.11 Ethane, ethene, and acetylene summary concentrations in B149 and B152
114
V. Stejskal et al.
ethane, and acetylene) of dechlorination in wells B149 and B152—wells situated in
the inflow and central area of RB; thus, this is the place where the greatest production
of ethane, ethene, and acetylene is expected.
The concentrations of nontoxic degradation products increased equally on both
wells during the first 155 days after application—B149 increases from 135 μg/L to
1200 μg/L and B152 from 205 μg/L to 1500 μg/L. B152 afterwards stagnates in time
until the end of the pilot test 311 days after the nZVI application, in contrast to B149,
where the concentration of the degradation products continuously increased in time
until the end of the pilot test. At the end of the pilot test, the concentrations of the
degradation products were observed in the inflow area 19 times higher than before
the injection of nZVI, respectively 6–7 times higher in the central area.
Documented increases of ethane, ethene, and acetylene confirmed degradation of
chlorinated hydrocarbons to nontoxic products of its decomposition.
6.5.3 Mass Balance
Prior to the technology installation, we carried out multiple sampling of CHC (May
2016, August 2016, February 2017, June 2017, and October 2017—just before the
application), which showed that the concentrations in all the monitoring points were
throughout the 18-month period of sampling relatively stable in the whole area. The
total CHC concentration was around 10 mg/L. Differences of CHC concentrations
between B139, B149, and B152 in the particular periods were in order of analytical
error (max. 10–15%).
Figure 6.12 shows the data collected after the application of nZVI and creation of
reactive barrier. The concentration scale and monitoring points are the same as in the
previous graph, only the sampling period is shorter. There are results of laboratory
Fig. 6.11 Ethane, ethene, and acetylene summary concentrations in B149 and B152
114
V. Stejskal et al.