

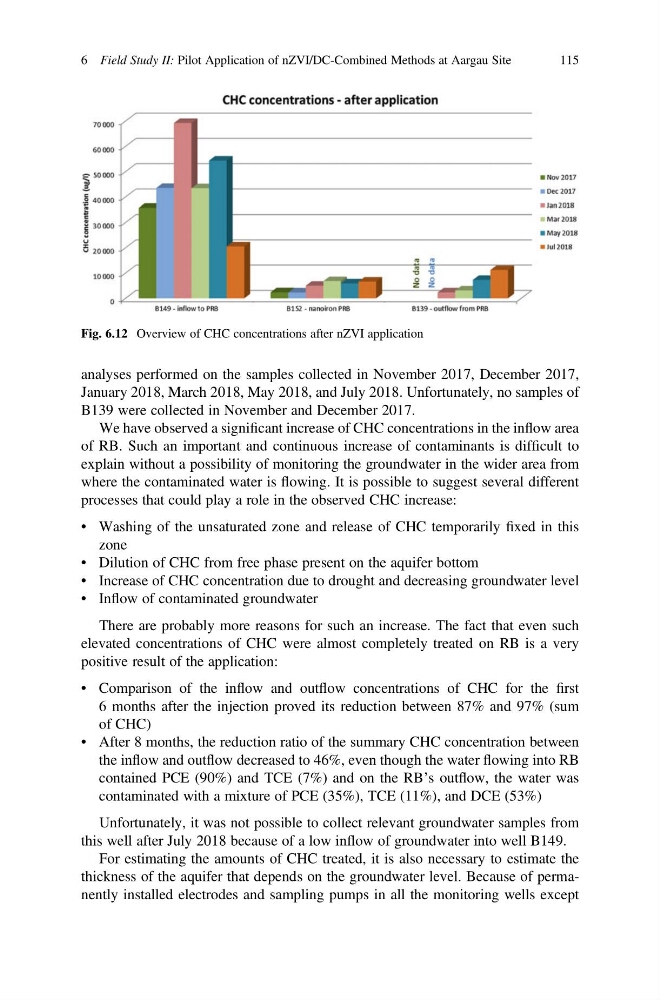
analyses performed on the samples collected in November 2017, December 2017,
January 2018, March 2018, May 2018, and July 2018. Unfortunately, no samples of
B139 were collected in November and December 2017.
We have observed a significant increase of CHC concentrations in the inflow area
of RB. Such an important and continuous increase of contaminants is difficult to
explain without a possibility of monitoring the groundwater in the wider area from
where the contaminated water is flowing. It is possible to suggest several different
processes that could play a role in the observed CHC increase:
• Washing of the unsaturated zone and release of CHC temporarily fixed in this
zone
• Dilution of CHC from free phase present on the aquifer bottom
• Increase of CHC concentration due to drought and decreasing groundwater level
• Inflow of contaminated groundwater
There are probably more reasons for such an increase. The fact that even such
elevated concentrations of CHC were almost completely treated on RB is a very
positive result of the application:
• Comparison of the inflow and outflow concentrations of CHC for the first
6 months after the injection proved its reduction between 87% and 97% (sum
of CHC)
• After 8 months, the reduction ratio of the summary CHC concentration between
the inflow and outflow decreased to 46%, even though the water flowing into RB
contained PCE (90%) and TCE (7%) and on the RB’s outflow, the water was
contaminated with a mixture of PCE (35%), TCE (11%), and DCE (53%)
Unfortunately, it was not possible to collect relevant groundwater samples from
this well after July 2018 because of a low inflow of groundwater into well B149.
For estimating the amounts of CHC treated, it is also necessary to estimate the
thickness of the aquifer that depends on the groundwater level. Because of permanently installed electrodes and sampling pumps in all the monitoring wells except
Fig. 6.12 Overview of CHC concentrations after nZVI application
6 Field Study II: Pilot Application of nZVI/DC-Combined Methods at Aargau Site
115
January 2018, March 2018, May 2018, and July 2018. Unfortunately, no samples of
B139 were collected in November and December 2017.
We have observed a significant increase of CHC concentrations in the inflow area
of RB. Such an important and continuous increase of contaminants is difficult to
explain without a possibility of monitoring the groundwater in the wider area from
where the contaminated water is flowing. It is possible to suggest several different
processes that could play a role in the observed CHC increase:
• Washing of the unsaturated zone and release of CHC temporarily fixed in this
zone
• Dilution of CHC from free phase present on the aquifer bottom
• Increase of CHC concentration due to drought and decreasing groundwater level
• Inflow of contaminated groundwater
There are probably more reasons for such an increase. The fact that even such
elevated concentrations of CHC were almost completely treated on RB is a very
positive result of the application:
• Comparison of the inflow and outflow concentrations of CHC for the first
6 months after the injection proved its reduction between 87% and 97% (sum
of CHC)
• After 8 months, the reduction ratio of the summary CHC concentration between
the inflow and outflow decreased to 46%, even though the water flowing into RB
contained PCE (90%) and TCE (7%) and on the RB’s outflow, the water was
contaminated with a mixture of PCE (35%), TCE (11%), and DCE (53%)
Unfortunately, it was not possible to collect relevant groundwater samples from
this well after July 2018 because of a low inflow of groundwater into well B149.
For estimating the amounts of CHC treated, it is also necessary to estimate the
thickness of the aquifer that depends on the groundwater level. Because of permanently installed electrodes and sampling pumps in all the monitoring wells except
Fig. 6.12 Overview of CHC concentrations after nZVI application
6 Field Study II: Pilot Application of nZVI/DC-Combined Methods at Aargau Site
115