

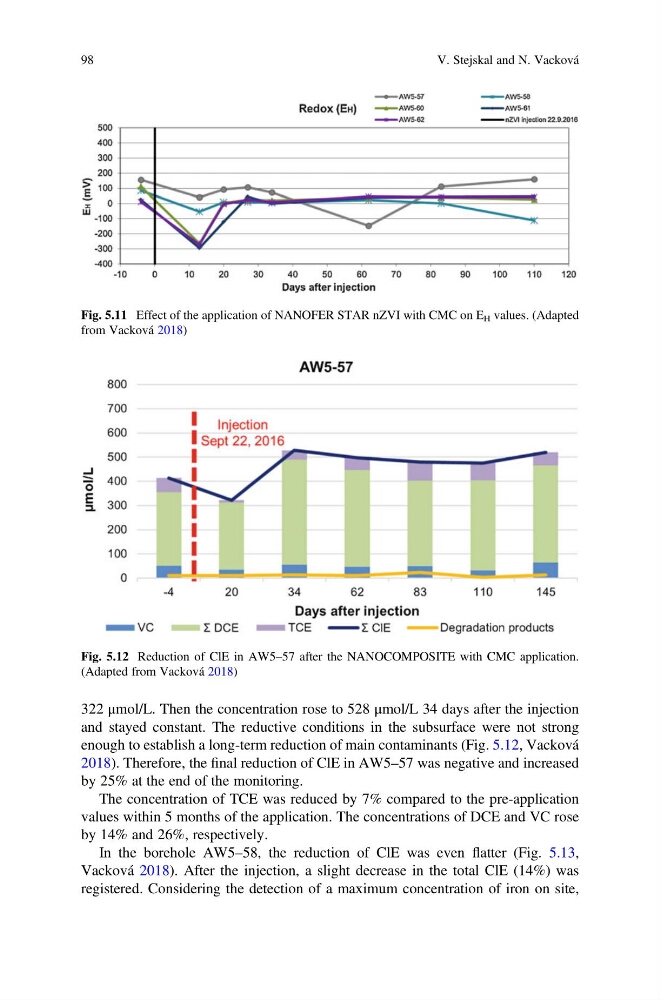
322 μmol/L. Then the concentration rose to 528 μmol/L 34 days after the injection
and stayed constant. The reductive conditions in the subsurface were not strong
enough to establish a long-term reduction of main contaminants (Fig. 5.12, Vacková
2018). Therefore, the final reduction of ClE in AW5–57 was negative and increased
by 25% at the end of the monitoring.
The concentration of TCE was reduced by 7% compared to the pre-application
values within 5 months of the application. The concentrations of DCE and VC rose
by 14% and 26%, respectively.
In the borehole AW5–58, the reduction of ClE was even flatter (Fig. 5.13,
Vacková 2018). After the injection, a slight decrease in the total ClE (14%) was
registered. Considering the detection of a maximum concentration of iron on site,
Fig. 5.11 Effect of the application of NANOFER STAR nZVI with CMC on E H values. (Adapted
from Vacková 2018)
Fig. 5.12 Reduction of ClE in AW5–57 after the NANOCOMPOSITE with CMC application.
(Adapted from Vacková 2018)
98
V. Stejskal and N. Vacková
and stayed constant. The reductive conditions in the subsurface were not strong
enough to establish a long-term reduction of main contaminants (Fig. 5.12, Vacková
2018). Therefore, the final reduction of ClE in AW5–57 was negative and increased
by 25% at the end of the monitoring.
The concentration of TCE was reduced by 7% compared to the pre-application
values within 5 months of the application. The concentrations of DCE and VC rose
by 14% and 26%, respectively.
In the borehole AW5–58, the reduction of ClE was even flatter (Fig. 5.13,
Vacková 2018). After the injection, a slight decrease in the total ClE (14%) was
registered. Considering the detection of a maximum concentration of iron on site,
Fig. 5.11 Effect of the application of NANOFER STAR nZVI with CMC on E H values. (Adapted
from Vacková 2018)
Fig. 5.12 Reduction of ClE in AW5–57 after the NANOCOMPOSITE with CMC application.
(Adapted from Vacková 2018)
98
V. Stejskal and N. Vacková