

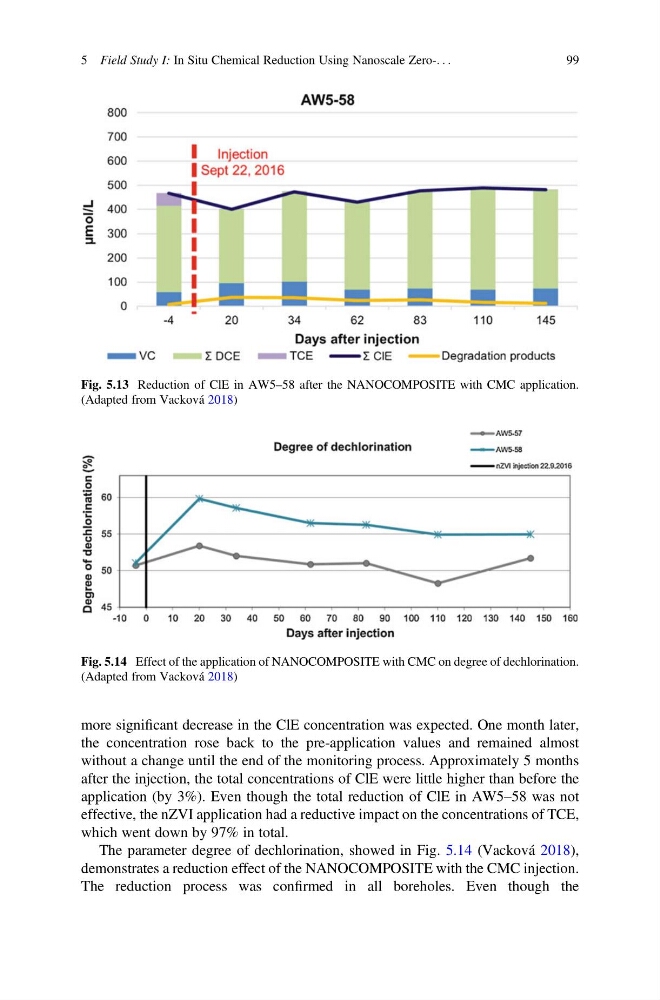
more significant decrease in the ClE concentration was expected. One month later,
the concentration rose back to the pre-application values and remained almost
without a change until the end of the monitoring process. Approximately 5 months
after the injection, the total concentrations of ClE were little higher than before the
application (by 3%). Even though the total reduction of ClE in AW5–58 was not
effective, the nZVI application had a reductive impact on the concentrations of TCE,
which went down by 97% in total.
The parameter degree of dechlorination, showed in Fig. 5.14 (Vacková 2018),
demonstrates a reduction effect of the NANOCOMPOSITE with the CMC injection.
The reduction process was confirmed in all boreholes. Even though the
Fig. 5.13 Reduction of ClE in AW5–58 after the NANOCOMPOSITE with CMC application.
(Adapted from Vacková 2018)
Fig. 5.14 Effect of the application of NANOCOMPOSITE with CMC on degree of dechlorination.
(Adapted from Vacková 2018)
5 Field Study I: In Situ Chemical Reduction Using Nanoscale Zero-. . .
99
the concentration rose back to the pre-application values and remained almost
without a change until the end of the monitoring process. Approximately 5 months
after the injection, the total concentrations of ClE were little higher than before the
application (by 3%). Even though the total reduction of ClE in AW5–58 was not
effective, the nZVI application had a reductive impact on the concentrations of TCE,
which went down by 97% in total.
The parameter degree of dechlorination, showed in Fig. 5.14 (Vacková 2018),
demonstrates a reduction effect of the NANOCOMPOSITE with the CMC injection.
The reduction process was confirmed in all boreholes. Even though the
Fig. 5.13 Reduction of ClE in AW5–58 after the NANOCOMPOSITE with CMC application.
(Adapted from Vacková 2018)
Fig. 5.14 Effect of the application of NANOCOMPOSITE with CMC on degree of dechlorination.
(Adapted from Vacková 2018)
5 Field Study I: In Situ Chemical Reduction Using Nanoscale Zero-. . .
99