

The optical properties of these synthesis nanoparticles were characterized by
fluorescence spectroscopy and UV-visible spectroscopy. In the presence of ultraviolet (UV) light (390 nm), the GQDs possess beautiful blue emission. The maximum emission is found to be at wavelength 470 nm. Compared to GQDs, the
emission curve of GQDs-catalytic strand shows a red-shift of a peak, and the
fluorescence intensity also gets reduced. This suggests the successful functionalization of GQDs and Au nanoparticles. Thus possess turn off fluorescence intensity.
The UV-visible spectra of Au nanoparticles and GQDs functionalized Au
nanoparticles were studied and the absorbance peak appeared at 518 nm. After
functionalization with GQDs, the peak was red-shifted to 523 nm, and the absorbance intensity also gets reduced. They provided one reason for reduction of
absorbance intensity. The absorbance of nanoparticles is associated with the shape
of the particles. The absorbance center of Au nanoparticles obtained at 518 nm.
Thus, with the changing of the shape of nanoparticles, shifting of the absorbance
center wavelength would occur. It may be due to as the Au nanoparticles were
absorbed on GQDs surface, there is an enhancement of the surface plasmon resonance (SPR) band of Au nanoparticles and reduced the absorbance intensity.
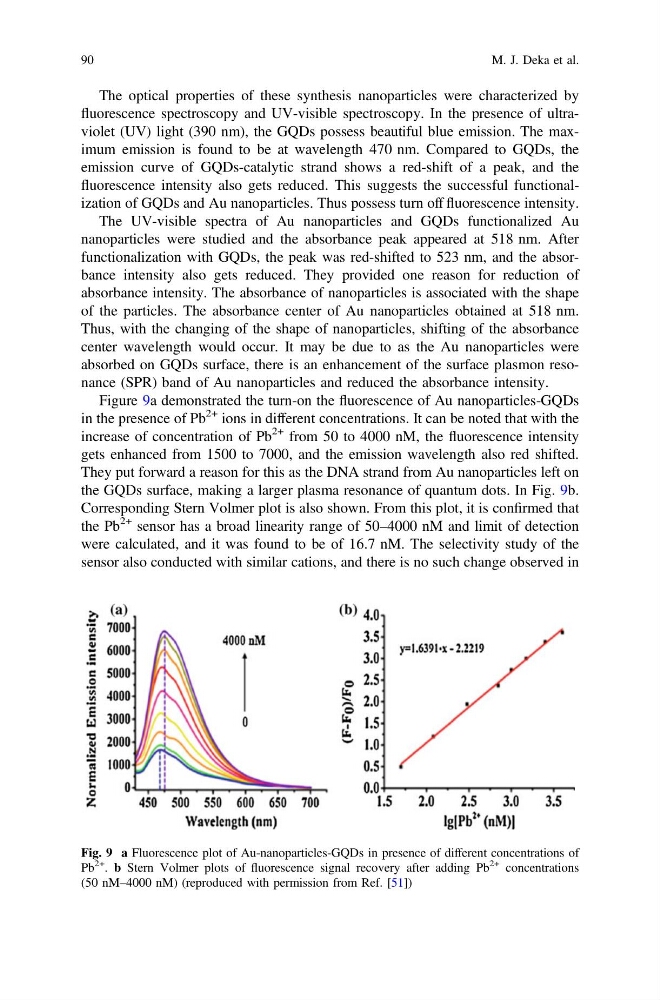
Figure 9a demonstrated the turn-on the fluorescence of Au nanoparticles-GQDs
in the presence of Pb
2+ ions in different concentrations. It can be noted that with the
increase of concentration of Pb
2+ from 50 to 4000 nM, the fluorescence intensity
gets enhanced from 1500 to 7000, and the emission wavelength also red shifted.
They put forward a reason for this as the DNA strand from Au nanoparticles left on
the GQDs surface, making a larger plasma resonance of quantum dots. In Fig. 9b.
Corresponding Stern Volmer plot is also shown. From this plot, it is confirmed that
the Pb
2+ sensor has a broad linearity range of 50–4000 nM and limit of detection
were calculated, and it was found to be of 16.7 nM. The selectivity study of the
sensor also conducted with similar cations, and there is no such change observed in
Fig. 9 a Fluorescence plot of Au-nanoparticles-GQDs in presence of different concentrations of
Pb
2+ . b Stern Volmer plots of fluorescence signal recovery after adding Pb
2+ concentrations
(50 nM–4000 nM) (reproduced with permission from Ref. [51])
90
M. J. Deka et al.
fluorescence spectroscopy and UV-visible spectroscopy. In the presence of ultraviolet (UV) light (390 nm), the GQDs possess beautiful blue emission. The maximum emission is found to be at wavelength 470 nm. Compared to GQDs, the
emission curve of GQDs-catalytic strand shows a red-shift of a peak, and the
fluorescence intensity also gets reduced. This suggests the successful functionalization of GQDs and Au nanoparticles. Thus possess turn off fluorescence intensity.
The UV-visible spectra of Au nanoparticles and GQDs functionalized Au
nanoparticles were studied and the absorbance peak appeared at 518 nm. After
functionalization with GQDs, the peak was red-shifted to 523 nm, and the absorbance intensity also gets reduced. They provided one reason for reduction of
absorbance intensity. The absorbance of nanoparticles is associated with the shape
of the particles. The absorbance center of Au nanoparticles obtained at 518 nm.
Thus, with the changing of the shape of nanoparticles, shifting of the absorbance
center wavelength would occur. It may be due to as the Au nanoparticles were
absorbed on GQDs surface, there is an enhancement of the surface plasmon resonance (SPR) band of Au nanoparticles and reduced the absorbance intensity.
Figure 9a demonstrated the turn-on the fluorescence of Au nanoparticles-GQDs
in the presence of Pb
2+ ions in different concentrations. It can be noted that with the
increase of concentration of Pb
2+ from 50 to 4000 nM, the fluorescence intensity
gets enhanced from 1500 to 7000, and the emission wavelength also red shifted.
They put forward a reason for this as the DNA strand from Au nanoparticles left on
the GQDs surface, making a larger plasma resonance of quantum dots. In Fig. 9b.
Corresponding Stern Volmer plot is also shown. From this plot, it is confirmed that
the Pb
2+ sensor has a broad linearity range of 50–4000 nM and limit of detection
were calculated, and it was found to be of 16.7 nM. The selectivity study of the
sensor also conducted with similar cations, and there is no such change observed in
Fig. 9 a Fluorescence plot of Au-nanoparticles-GQDs in presence of different concentrations of
Pb
2+ . b Stern Volmer plots of fluorescence signal recovery after adding Pb
2+ concentrations
(50 nM–4000 nM) (reproduced with permission from Ref. [51])
90
M. J. Deka et al.