

fluorescence intensity for such ions. Thus, the fluorescence sensor was sensitive as
well as selective for only Pb
2+ [51].
Hua Wang and his group recently developed a GQDs based fluorescent
nanosensor for silver ions in an aqueous medium as silver ions are also included
highest toxicity class of heavy metal groups, that’s why detection of silver ions is
also essential. The commercially available GQDs are characterized by TEM and
AFM characterization techniques. From the TEM and AFM images, the sizes of the
GQDs are found to be below 10 nm, particles are well separated and show
homogeneous the dispersibility. The corresponding particle size distribution curve
also plotted, and the average particle size (diameter) is calculated at about 2.9 nm.
From the atomic force microscopy (AFM) imaging the thickness was calculated
from the height profile diagram and found to be 1.2 and 4.0 nm, which suggests
stacking of a few graphene layers.
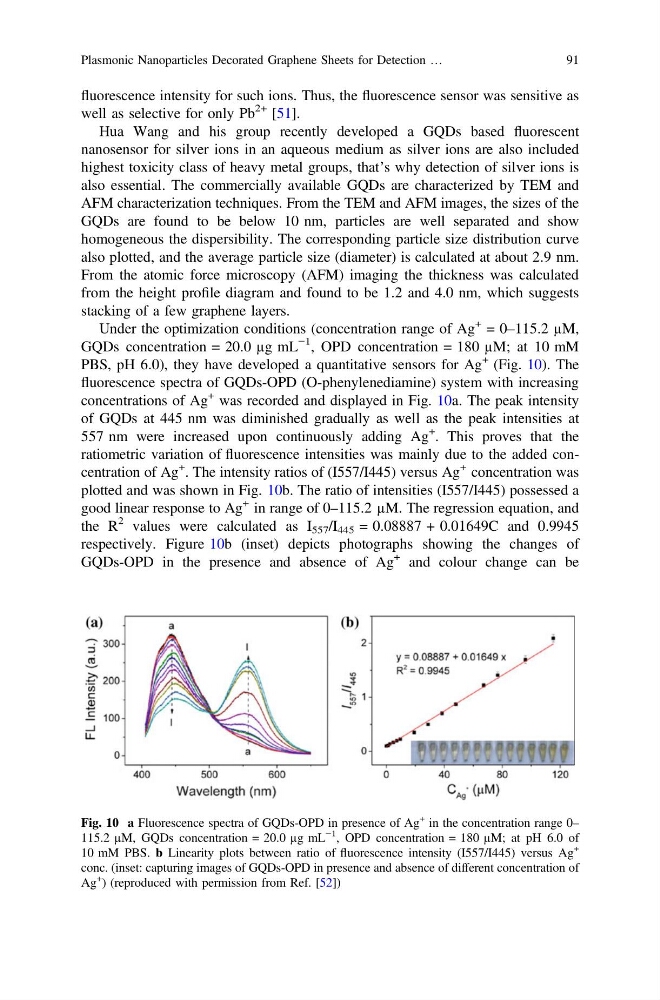
Under the optimization conditions (concentration range of Ag
+ = 0–115.2 µM,
GQDs concentration = 20.0 µg mL
−1 , OPD concentration = 180 µM; at 10 mM
PBS, pH 6.0), they have developed a quantitative sensors for Ag
+ (Fig. 10). The
fluorescence spectra of GQDs-OPD (O-phenylenediamine) system with increasing
concentrations of Ag
+ was recorded and displayed in Fig. 10a. The peak intensity
of GQDs at 445 nm was diminished gradually as well as the peak intensities at
557 nm were increased upon continuously adding Ag
+
. This proves that the
ratiometric variation of fluorescence intensities was mainly due to the added concentration of Ag
+
. The intensity ratios of (I557/I445) versus Ag
+ concentration was
plotted and was shown in Fig. 10b. The ratio of intensities (I557/I445) possessed a
good linear response to Ag
+ in range of 0–115.2 µM. The regression equation, and
the R
2 values were calculated as I 557 /I 445 = 0.08887 + 0.01649C and 0.9945
respectively. Figure 10b (inset) depicts photographs showing the changes of
GQDs-OPD in the presence and absence of Ag
+ and colour change can be
Fig. 10 a Fluorescence spectra of GQDs-OPD in presence of Ag
+ in the concentration range 0–
115.2 µM, GQDs concentration = 20.0 µg mL
−1
, OPD concentration = 180 µM; at pH 6.0 of
10 mM PBS. b Linearity plots between ratio of fluorescence intensity (I557/I445) versus Ag
+
conc. (inset: capturing images of GQDs-OPD in presence and absence of different concentration of
Ag
+ ) (reproduced with permission from Ref. [52])
Plasmonic Nanoparticles Decorated Graphene Sheets for Detection …
91
well as selective for only Pb
2+ [51].
Hua Wang and his group recently developed a GQDs based fluorescent
nanosensor for silver ions in an aqueous medium as silver ions are also included
highest toxicity class of heavy metal groups, that’s why detection of silver ions is
also essential. The commercially available GQDs are characterized by TEM and
AFM characterization techniques. From the TEM and AFM images, the sizes of the
GQDs are found to be below 10 nm, particles are well separated and show
homogeneous the dispersibility. The corresponding particle size distribution curve
also plotted, and the average particle size (diameter) is calculated at about 2.9 nm.
From the atomic force microscopy (AFM) imaging the thickness was calculated
from the height profile diagram and found to be 1.2 and 4.0 nm, which suggests
stacking of a few graphene layers.
Under the optimization conditions (concentration range of Ag
+ = 0–115.2 µM,
GQDs concentration = 20.0 µg mL
−1 , OPD concentration = 180 µM; at 10 mM
PBS, pH 6.0), they have developed a quantitative sensors for Ag
+ (Fig. 10). The
fluorescence spectra of GQDs-OPD (O-phenylenediamine) system with increasing
concentrations of Ag
+ was recorded and displayed in Fig. 10a. The peak intensity
of GQDs at 445 nm was diminished gradually as well as the peak intensities at
557 nm were increased upon continuously adding Ag
+
. This proves that the
ratiometric variation of fluorescence intensities was mainly due to the added concentration of Ag
+
. The intensity ratios of (I557/I445) versus Ag
+ concentration was
plotted and was shown in Fig. 10b. The ratio of intensities (I557/I445) possessed a
good linear response to Ag
+ in range of 0–115.2 µM. The regression equation, and
the R
2 values were calculated as I 557 /I 445 = 0.08887 + 0.01649C and 0.9945
respectively. Figure 10b (inset) depicts photographs showing the changes of
GQDs-OPD in the presence and absence of Ag
+ and colour change can be
Fig. 10 a Fluorescence spectra of GQDs-OPD in presence of Ag
+ in the concentration range 0–
115.2 µM, GQDs concentration = 20.0 µg mL
−1
, OPD concentration = 180 µM; at pH 6.0 of
10 mM PBS. b Linearity plots between ratio of fluorescence intensity (I557/I445) versus Ag
+
conc. (inset: capturing images of GQDs-OPD in presence and absence of different concentration of
Ag
+ ) (reproduced with permission from Ref. [52])
Plasmonic Nanoparticles Decorated Graphene Sheets for Detection …
91