

6.2.2 High-Performance Liquid Chromatography (HPLC)
A sample (liquid or solid sample dissolved in a suitable solvent) is helped in HPLC
through a mobile fluid phase through a chromatographic segment. Separation is
controlled by interactions between the solution and the stationary phase. The
detachment uses a single mobile phase of fixed composition in isocratic elution.
Usually, it is not easy to locate a single mobile phase composition suitable for all
solutes. Therefore, using a gradient phase is the only choice. The mobile phase’s
underlying composition is moderately polar to separate the reverse phase. The
composition of the mobile phase is made less polar as the separation advances these
separations. As with GC, different detectors have been produced for the monitoring
of HPLC separation and incorporate spectroscopic detectors (e.g. UV/Vis absorption and fluorescence), electrochemical finders and ongoing advances in mass
spectrometry have led to a growing enthusiasm for liquid chromatography-mass
spectrometry (LC-MS).
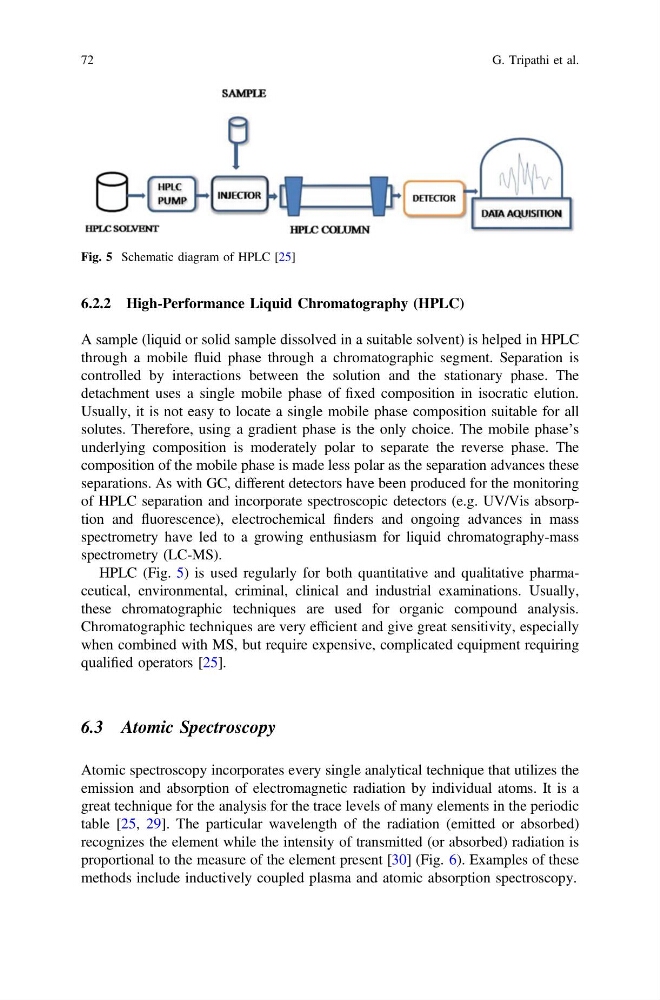
HPLC (Fig. 5) is used regularly for both quantitative and qualitative pharmaceutical, environmental, criminal, clinical and industrial examinations. Usually,
these chromatographic techniques are used for organic compound analysis.
Chromatographic techniques are very efficient and give great sensitivity, especially
when combined with MS, but require expensive, complicated equipment requiring
qualified operators [25].
6.3 Atomic Spectroscopy
Atomic spectroscopy incorporates every single analytical technique that utilizes the
emission and absorption of electromagnetic radiation by individual atoms. It is a
great technique for the analysis for the trace levels of many elements in the periodic
table [25, 29]. The particular wavelength of the radiation (emitted or absorbed)
recognizes the element while the intensity of transmitted (or absorbed) radiation is
proportional to the measure of the element present [30] (Fig. 6). Examples of these
methods include inductively coupled plasma and atomic absorption spectroscopy.
Fig. 5 Schematic diagram of HPLC [25]
72
G. Tripathi et al.
A sample (liquid or solid sample dissolved in a suitable solvent) is helped in HPLC
through a mobile fluid phase through a chromatographic segment. Separation is
controlled by interactions between the solution and the stationary phase. The
detachment uses a single mobile phase of fixed composition in isocratic elution.
Usually, it is not easy to locate a single mobile phase composition suitable for all
solutes. Therefore, using a gradient phase is the only choice. The mobile phase’s
underlying composition is moderately polar to separate the reverse phase. The
composition of the mobile phase is made less polar as the separation advances these
separations. As with GC, different detectors have been produced for the monitoring
of HPLC separation and incorporate spectroscopic detectors (e.g. UV/Vis absorption and fluorescence), electrochemical finders and ongoing advances in mass
spectrometry have led to a growing enthusiasm for liquid chromatography-mass
spectrometry (LC-MS).
HPLC (Fig. 5) is used regularly for both quantitative and qualitative pharmaceutical, environmental, criminal, clinical and industrial examinations. Usually,
these chromatographic techniques are used for organic compound analysis.
Chromatographic techniques are very efficient and give great sensitivity, especially
when combined with MS, but require expensive, complicated equipment requiring
qualified operators [25].
6.3 Atomic Spectroscopy
Atomic spectroscopy incorporates every single analytical technique that utilizes the
emission and absorption of electromagnetic radiation by individual atoms. It is a
great technique for the analysis for the trace levels of many elements in the periodic
table [25, 29]. The particular wavelength of the radiation (emitted or absorbed)
recognizes the element while the intensity of transmitted (or absorbed) radiation is
proportional to the measure of the element present [30] (Fig. 6). Examples of these
methods include inductively coupled plasma and atomic absorption spectroscopy.
Fig. 5 Schematic diagram of HPLC [25]
72
G. Tripathi et al.