

116
and FactSage. Stangeland and co-workers (2018) have used the RGibbs module,
available in the Aspen Plus software to study the thermodynamic equilibrium of
different mixtures of carbon dioxide and hydrogen under various conditions of temperature and pressure. In this study, the authors have considered the equilibrium of
the following components: carbon dioxide, carbon monoxide, hydrogen, and
methanol. Methane and higher hydrocarbons have not been selected as products of
this simulation. In fact, they are not favorable products over typically employed
copper- based catalysts under the synthesis reaction conditions used (Stangeland
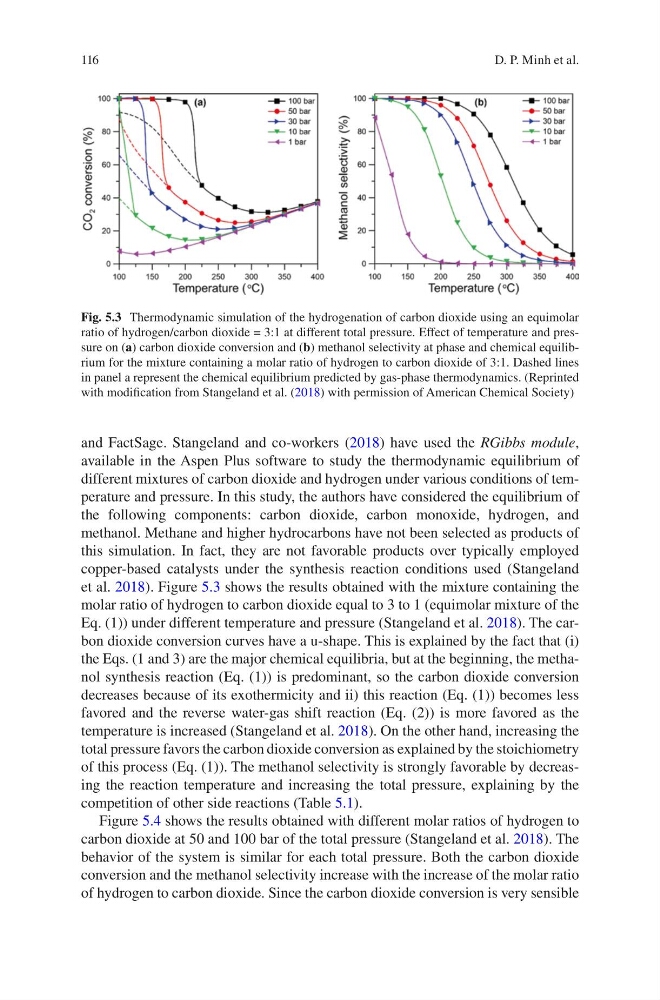
et al. 2018). Figure 5.3 shows the results obtained with the mixture containing the
molar ratio of hydrogen to carbon dioxide equal to 3 to 1 (equimolar mixture of the
Eq. (1)) under different temperature and pressure (Stangeland et al. 2018). The carbon dioxide conversion curves have a u-shape. This is explained by the fact that (i)
the Eqs. (1 and 3) are the major chemical equilibria, but at the beginning, the methanol synthesis reaction (Eq. (1)) is predominant, so the carbon dioxide conversion
decreases because of its exothermicity and ii) this reaction (Eq. (1)) becomes less
favored and the reverse water-gas shift reaction (Eq. (2)) is more favored as the
temperature is increased (Stangeland et al. 2018). On the other hand, increasing the
total pressure favors the carbon dioxide conversion as explained by the stoichiometry
of this process (Eq. (1)). The methanol selectivity is strongly favorable by decreasing the reaction temperature and increasing the total pressure, explaining by the
competition of other side reactions (Table 5.1).
Figure 5.4 shows the results obtained with different molar ratios of hydrogen to
carbon dioxide at 50 and 100 bar of the total pressure (Stangeland et al. 2018). The
behavior of the system is similar for each total pressure. Both the carbon dioxide
conversion and the methanol selectivity increase with the increase of the molar ratio
of hydrogen to carbon dioxide. Since the carbon dioxide conversion is very sensible
Fig. 5.3 Thermodynamic simulation of the hydrogenation of carbon dioxide using an equimolar
ratio of hydrogen/carbon dioxide = 3:1 at different total pressure. Effect of temperature and pressure on (a) carbon dioxide conversion and (b) methanol selectivity at phase and chemical equilibrium for the mixture containing a molar ratio of hydrogen to carbon dioxide of 3:1. Dashed lines
in panel a represent the chemical equilibrium predicted by gas-phase thermodynamics. (Reprinted
with modification from Stangeland et al. (2018) with permission of American Chemical Society)
D. P. Minh et al.
and FactSage. Stangeland and co-workers (2018) have used the RGibbs module,
available in the Aspen Plus software to study the thermodynamic equilibrium of
different mixtures of carbon dioxide and hydrogen under various conditions of temperature and pressure. In this study, the authors have considered the equilibrium of
the following components: carbon dioxide, carbon monoxide, hydrogen, and
methanol. Methane and higher hydrocarbons have not been selected as products of
this simulation. In fact, they are not favorable products over typically employed
copper- based catalysts under the synthesis reaction conditions used (Stangeland
et al. 2018). Figure 5.3 shows the results obtained with the mixture containing the
molar ratio of hydrogen to carbon dioxide equal to 3 to 1 (equimolar mixture of the
Eq. (1)) under different temperature and pressure (Stangeland et al. 2018). The carbon dioxide conversion curves have a u-shape. This is explained by the fact that (i)
the Eqs. (1 and 3) are the major chemical equilibria, but at the beginning, the methanol synthesis reaction (Eq. (1)) is predominant, so the carbon dioxide conversion
decreases because of its exothermicity and ii) this reaction (Eq. (1)) becomes less
favored and the reverse water-gas shift reaction (Eq. (2)) is more favored as the
temperature is increased (Stangeland et al. 2018). On the other hand, increasing the
total pressure favors the carbon dioxide conversion as explained by the stoichiometry
of this process (Eq. (1)). The methanol selectivity is strongly favorable by decreasing the reaction temperature and increasing the total pressure, explaining by the
competition of other side reactions (Table 5.1).
Figure 5.4 shows the results obtained with different molar ratios of hydrogen to
carbon dioxide at 50 and 100 bar of the total pressure (Stangeland et al. 2018). The
behavior of the system is similar for each total pressure. Both the carbon dioxide
conversion and the methanol selectivity increase with the increase of the molar ratio
of hydrogen to carbon dioxide. Since the carbon dioxide conversion is very sensible
Fig. 5.3 Thermodynamic simulation of the hydrogenation of carbon dioxide using an equimolar
ratio of hydrogen/carbon dioxide = 3:1 at different total pressure. Effect of temperature and pressure on (a) carbon dioxide conversion and (b) methanol selectivity at phase and chemical equilibrium for the mixture containing a molar ratio of hydrogen to carbon dioxide of 3:1. Dashed lines
in panel a represent the chemical equilibrium predicted by gas-phase thermodynamics. (Reprinted
with modification from Stangeland et al. (2018) with permission of American Chemical Society)
D. P. Minh et al.