

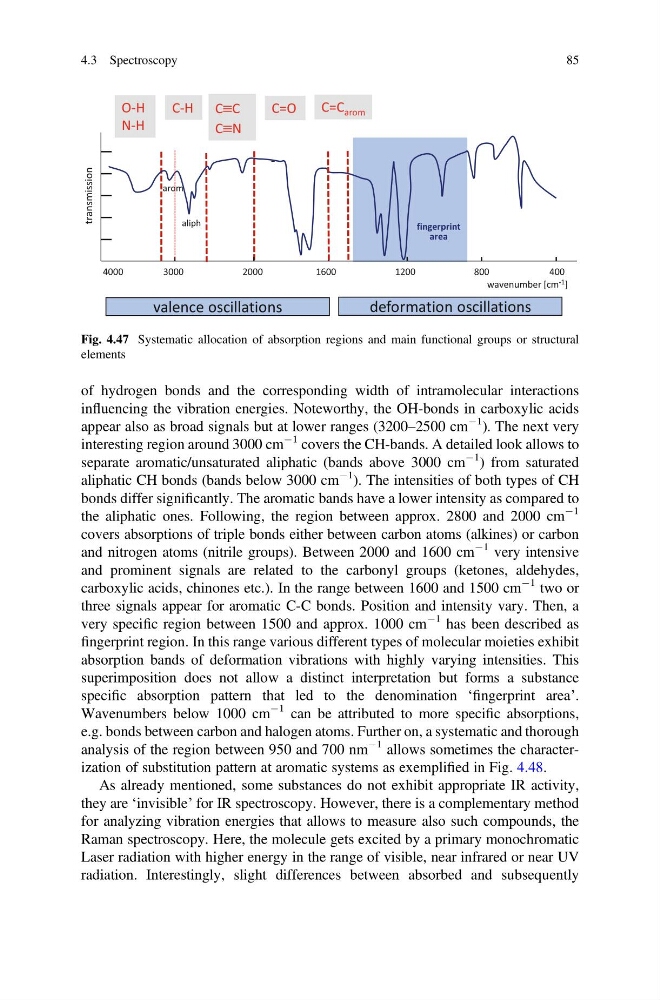
of hydrogen bonds and the corresponding width of intramolecular interactions
influencing the vibration energies. Noteworthy, the OH-bonds in carboxylic acids
appear also as broad signals but at lower ranges (3200–2500 cm
À1 ). The next very
interesting region around 3000 cm
À1 covers the CH-bands. A detailed look allows to
separate aromatic/unsaturated aliphatic (bands above 3000 cm
À1 ) from saturated
aliphatic CH bonds (bands below 3000 cm
À1 ). The intensities of both types of CH
bonds differ significantly. The aromatic bands have a lower intensity as compared to
the aliphatic ones. Following, the region between approx. 2800 and 2000 cm
À1
covers absorptions of triple bonds either between carbon atoms (alkines) or carbon
and nitrogen atoms (nitrile groups). Between 2000 and 1600 cm
À1 very intensive
and prominent signals are related to the carbonyl groups (ketones, aldehydes,
carboxylic acids, chinones etc.). In the range between 1600 and 1500 cm
À1 two or
three signals appear for aromatic C-C bonds. Position and intensity vary. Then, a
very specific region between 1500 and approx. 1000 cm
À1 has been described as
fingerprint region. In this range various different types of molecular moieties exhibit
absorption bands of deformation vibrations with highly varying intensities. This
superimposition does not allow a distinct interpretation but forms a substance
specific absorption pattern that led to the denomination ‘fingerprint area’.
Wavenumbers below 1000 cm
À1 can be attributed to more specific absorptions,
e.g. bonds between carbon and halogen atoms. Further on, a systematic and thorough
analysis of the region between 950 and 700 nm
À1 allows sometimes the characterization of substitution pattern at aromatic systems as exemplified in Fig. 4.48.
As already mentioned, some substances do not exhibit appropriate IR activity,
they are ‘invisible’ for IR spectroscopy. However, there is a complementary method
for analyzing vibration energies that allows to measure also such compounds, the
Raman spectroscopy. Here, the molecule gets excited by a primary monochromatic
Laser radiation with higher energy in the range of visible, near infrared or near UV
radiation. Interestingly, slight differences between absorbed and subsequently
4000
3000
2000
1200
800
400
1600
valence oscillat ions
deformat ion oscillat ions
wavenumber [cm -1 ]
f ingerprint
area
aliph
arom
transmission
C=O
O-H
N-H
C-H C≡C
C≡N
C=C arom
Fig. 4.47 Systematic allocation of absorption regions and main functional groups or structural
elements
4.3 Spectroscopy
85
influencing the vibration energies. Noteworthy, the OH-bonds in carboxylic acids
appear also as broad signals but at lower ranges (3200–2500 cm
À1 ). The next very
interesting region around 3000 cm
À1 covers the CH-bands. A detailed look allows to
separate aromatic/unsaturated aliphatic (bands above 3000 cm
À1 ) from saturated
aliphatic CH bonds (bands below 3000 cm
À1 ). The intensities of both types of CH
bonds differ significantly. The aromatic bands have a lower intensity as compared to
the aliphatic ones. Following, the region between approx. 2800 and 2000 cm
À1
covers absorptions of triple bonds either between carbon atoms (alkines) or carbon
and nitrogen atoms (nitrile groups). Between 2000 and 1600 cm
À1 very intensive
and prominent signals are related to the carbonyl groups (ketones, aldehydes,
carboxylic acids, chinones etc.). In the range between 1600 and 1500 cm
À1 two or
three signals appear for aromatic C-C bonds. Position and intensity vary. Then, a
very specific region between 1500 and approx. 1000 cm
À1 has been described as
fingerprint region. In this range various different types of molecular moieties exhibit
absorption bands of deformation vibrations with highly varying intensities. This
superimposition does not allow a distinct interpretation but forms a substance
specific absorption pattern that led to the denomination ‘fingerprint area’.
Wavenumbers below 1000 cm
À1 can be attributed to more specific absorptions,
e.g. bonds between carbon and halogen atoms. Further on, a systematic and thorough
analysis of the region between 950 and 700 nm
À1 allows sometimes the characterization of substitution pattern at aromatic systems as exemplified in Fig. 4.48.
As already mentioned, some substances do not exhibit appropriate IR activity,
they are ‘invisible’ for IR spectroscopy. However, there is a complementary method
for analyzing vibration energies that allows to measure also such compounds, the
Raman spectroscopy. Here, the molecule gets excited by a primary monochromatic
Laser radiation with higher energy in the range of visible, near infrared or near UV
radiation. Interestingly, slight differences between absorbed and subsequently
4000
3000
2000
1200
800
400
1600
valence oscillat ions
deformat ion oscillat ions
wavenumber [cm -1 ]
f ingerprint
area
aliph
arom
transmission
C=O
O-H
N-H
C-H C≡C
C≡N
C=C arom
Fig. 4.47 Systematic allocation of absorption regions and main functional groups or structural
elements
4.3 Spectroscopy
85