

Unfortunately, the IR spectra are normally reported with an x-axis covering
wavenumbers between approx. 400–4000 nm
À1 but with decreasing values. Further
on, not the absorption strength is given on the y-axis but with the transmission
leading to a negative excursion of the measured values in case of absorption. An
example is given in Fig. 4.46.
However, the interpretation of IR absorption in a spectrum seems to be difficult
due to the complex vibrations and the numerous parameters influencing them.
Fortunately, as a result of complex theoretical considerations, a very simple interpretation approaches allows the direct linkage of functional groups and isolated
structural elements to observed absorption bands in IR spectra. With simple words,
for a given structural moiety (e.g. an aliphatic double bond, a nitrile group or an
aldehyde group) a clearly defined absorption area can be found. For some functional
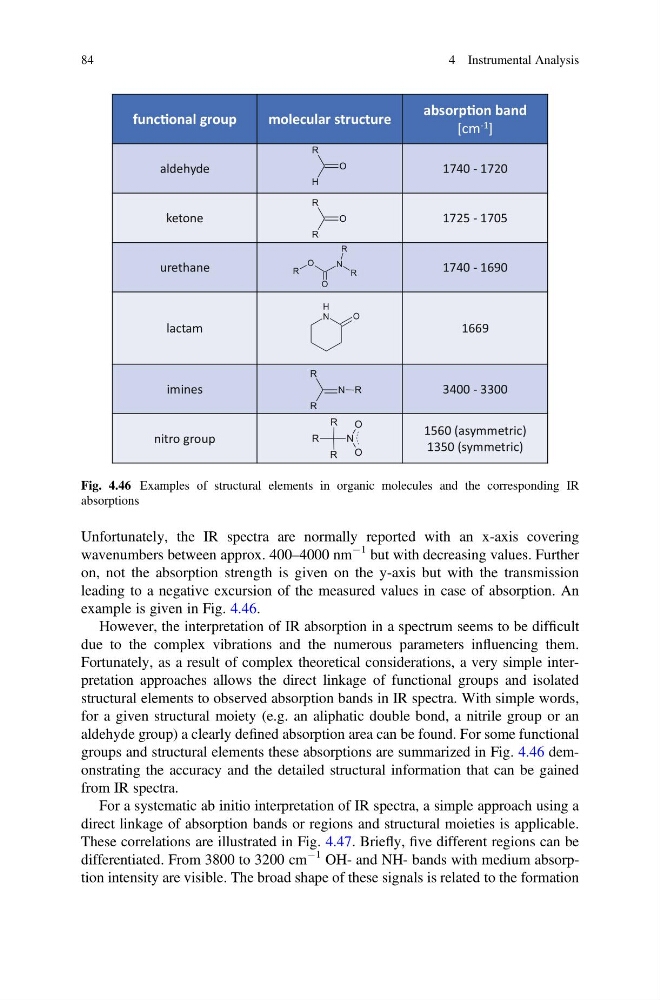
groups and structural elements these absorptions are summarized in Fig. 4.46 demonstrating the accuracy and the detailed structural information that can be gained
from IR spectra.
For a systematic ab initio interpretation of IR spectra, a simple approach using a
direct linkage of absorption bands or regions and structural moieties is applicable.
These correlations are illustrated in Fig. 4.47. Briefly, five different regions can be
differentiated. From 3800 to 3200 cm
À1 OH- and NH- bands with medium absorption intensity are visible. The broad shape of these signals is related to the formation
funcƟonal group
molecular structure
absorpƟon band
[cm -1 ]
aldehyde
1740 - 1720
ketone
1725 - 1705
urethane
1740 - 1690
lactam
1669
imines
3400 - 3300
nitro group
1560 (asymmetric)
1350 (symmetric)
N
H
O
O
R
H
N
R
R
R
R
O
N
O
R
R
O
R
R
R
R
R
N
O
O
Fig. 4.46 Examples of structural elements in organic molecules and the corresponding IR
absorptions
84
4 Instrumental Analysis
wavenumbers between approx. 400–4000 nm
À1 but with decreasing values. Further
on, not the absorption strength is given on the y-axis but with the transmission
leading to a negative excursion of the measured values in case of absorption. An
example is given in Fig. 4.46.
However, the interpretation of IR absorption in a spectrum seems to be difficult
due to the complex vibrations and the numerous parameters influencing them.
Fortunately, as a result of complex theoretical considerations, a very simple interpretation approaches allows the direct linkage of functional groups and isolated
structural elements to observed absorption bands in IR spectra. With simple words,
for a given structural moiety (e.g. an aliphatic double bond, a nitrile group or an
aldehyde group) a clearly defined absorption area can be found. For some functional
groups and structural elements these absorptions are summarized in Fig. 4.46 demonstrating the accuracy and the detailed structural information that can be gained
from IR spectra.
For a systematic ab initio interpretation of IR spectra, a simple approach using a
direct linkage of absorption bands or regions and structural moieties is applicable.
These correlations are illustrated in Fig. 4.47. Briefly, five different regions can be
differentiated. From 3800 to 3200 cm
À1 OH- and NH- bands with medium absorption intensity are visible. The broad shape of these signals is related to the formation
funcƟonal group
molecular structure
absorpƟon band
[cm -1 ]
aldehyde
1740 - 1720
ketone
1725 - 1705
urethane
1740 - 1690
lactam
1669
imines
3400 - 3300
nitro group
1560 (asymmetric)
1350 (symmetric)
N
H
O
O
R
H
N
R
R
R
R
O
N
O
R
R
O
R
R
R
R
R
N
O
O
Fig. 4.46 Examples of structural elements in organic molecules and the corresponding IR
absorptions
84
4 Instrumental Analysis