

been used initially as tool for isotope analyses. In modern mass spectrometry
certainly also isotope analyses are performed. However, in organic mass spectrometry as described so far, isotopes are detectable and visible in the spectra. The
corresponding elements cover mainly carbon and hydrogen as well as oxygen,
sulphur, nitrogen and halogens. Noteworthy, for organic molecules only a few stable
isotopes are of interest. To use the analytical potential of these isotopes, the relative
abundance of the isotope signals needs to be high enough to unambiguously identify
the isotopic signals. Beside the abundance, also the mass differences are significant
as summarized in Table 5.2.
Most important element in organic chemistry is carbon, that exhibits one stable
isotope in addition to
12 C, the
13 C isotope representing a so-called ‘A+1’ isotope.
The relative abundance of
13 C is low with around 1%, hence this signal is not very
100
300
250
50
H
R
O
+
OMe
C
R
O
+
OMe
H
R
C
O
+
H
OMe
O
OMe
OMe
H
101
171
326
74
241
O
241
171
101
74
150
200
Relative intensity
m/z
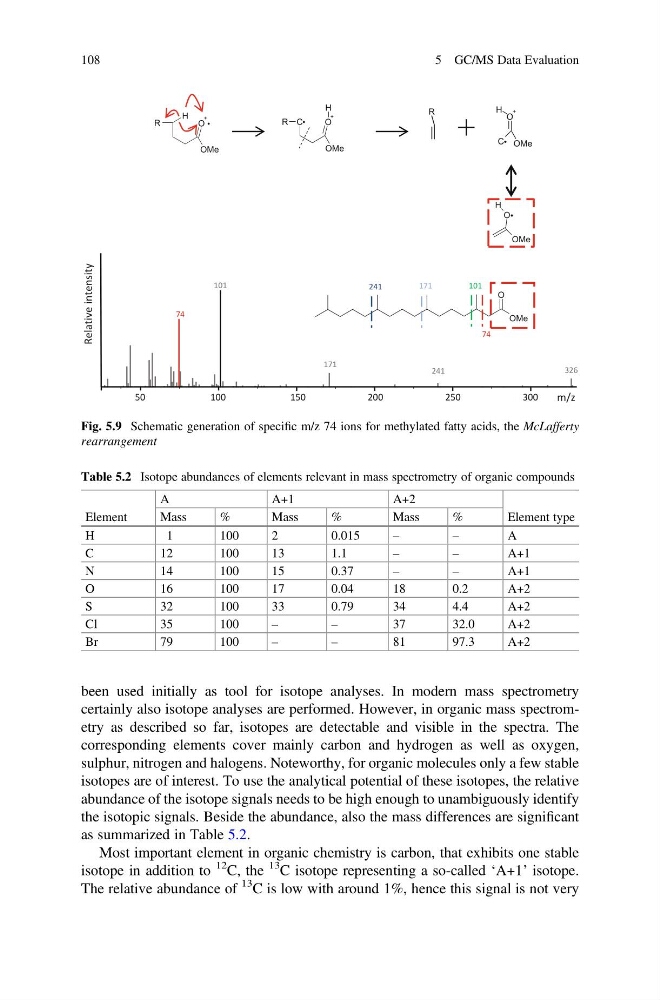
Fig. 5.9 Schematic generation of specific m/z 74 ions for methylated fatty acids, the McLafferty
rearrangement
Table 5.2 Isotope abundances of elements relevant in mass spectrometry of organic compounds
Element
A
A+1
A+2
Element type
Mass
%
Mass
%
Mass
%
H
1
100
2
0.015
–
–
A
C
12
100
13
1.1
–
–
A+1
N
14
100
15
0.37
–
–
A+1
O
16
100
17
0.04
18
0.2
A+2
S
32
100
33
0.79
34
4.4
A+2
Cl
35
100
–
–
37
32.0
A+2
Br
79
100
–
–
81
97.3
A+2
108
5 GC/MS Data Evaluation
certainly also isotope analyses are performed. However, in organic mass spectrometry as described so far, isotopes are detectable and visible in the spectra. The
corresponding elements cover mainly carbon and hydrogen as well as oxygen,
sulphur, nitrogen and halogens. Noteworthy, for organic molecules only a few stable
isotopes are of interest. To use the analytical potential of these isotopes, the relative
abundance of the isotope signals needs to be high enough to unambiguously identify
the isotopic signals. Beside the abundance, also the mass differences are significant
as summarized in Table 5.2.
Most important element in organic chemistry is carbon, that exhibits one stable
isotope in addition to
12 C, the
13 C isotope representing a so-called ‘A+1’ isotope.
The relative abundance of
13 C is low with around 1%, hence this signal is not very
100
300
250
50
H
R
O
+
OMe
C
R
O
+
OMe
H
R
C
O
+
H
OMe
O
OMe
OMe
H
101
171
326
74
241
O
241
171
101
74
150
200
Relative intensity
m/z
Fig. 5.9 Schematic generation of specific m/z 74 ions for methylated fatty acids, the McLafferty
rearrangement
Table 5.2 Isotope abundances of elements relevant in mass spectrometry of organic compounds
Element
A
A+1
A+2
Element type
Mass
%
Mass
%
Mass
%
H
1
100
2
0.015
–
–
A
C
12
100
13
1.1
–
–
A+1
N
14
100
15
0.37
–
–
A+1
O
16
100
17
0.04
18
0.2
A+2
S
32
100
33
0.79
34
4.4
A+2
Cl
35
100
–
–
37
32.0
A+2
Br
79
100
–
–
81
97.3
A+2
108
5 GC/MS Data Evaluation