

significant. However, the low abundance of the signal will compensate by the
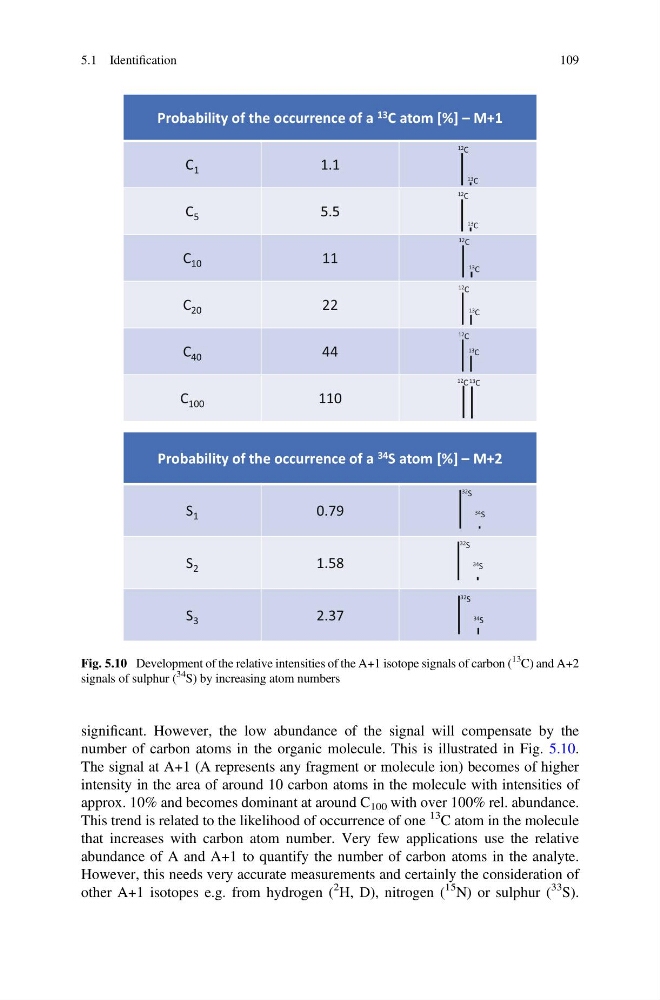
number of carbon atoms in the organic molecule. This is illustrated in Fig. 5.10.
The signal at A+1 (A represents any fragment or molecule ion) becomes of higher
intensity in the area of around 10 carbon atoms in the molecule with intensities of
approx. 10% and becomes dominant at around C 100 with over 100% rel. abundance.
This trend is related to the likelihood of occurrence of one
13
C atom in the molecule
that increases with carbon atom number. Very few applications use the relative
abundance of A and A+1 to quantify the number of carbon atoms in the analyte.
However, this needs very accurate measurements and certainly the consideration of
other A+1 isotopes e.g. from hydrogen (
2 H, D), nitrogen (
15 N) or sulphur (
33 S).
Probability of the occurrence of a 13 C atom [%] – M+1
C 1
1.1
C 5
5.5
C 10
11
C 20
22
C 40
44
C 100
110
Probability of the occurrence of a 34 S atom [%] – M+2
S 1
0.79
S 2
1.58
S 3
2.37
13 C
12 C
13 C
12 C
13 C
12 C
13 C
12 C
13 C
12 C
13 C
12 C
34 S
32 S
34 S
32 S
34 S
32 S
Fig. 5.10 Development of the relative intensities of the A+1 isotope signals of carbon (
13
C) and A+2
signals of sulphur (
34
S) by increasing atom numbers
5.1 Identification
109
number of carbon atoms in the organic molecule. This is illustrated in Fig. 5.10.
The signal at A+1 (A represents any fragment or molecule ion) becomes of higher
intensity in the area of around 10 carbon atoms in the molecule with intensities of
approx. 10% and becomes dominant at around C 100 with over 100% rel. abundance.
This trend is related to the likelihood of occurrence of one
13
C atom in the molecule
that increases with carbon atom number. Very few applications use the relative
abundance of A and A+1 to quantify the number of carbon atoms in the analyte.
However, this needs very accurate measurements and certainly the consideration of
other A+1 isotopes e.g. from hydrogen (
2 H, D), nitrogen (
15 N) or sulphur (
33 S).
Probability of the occurrence of a 13 C atom [%] – M+1
C 1
1.1
C 5
5.5
C 10
11
C 20
22
C 40
44
C 100
110
Probability of the occurrence of a 34 S atom [%] – M+2
S 1
0.79
S 2
1.58
S 3
2.37
13 C
12 C
13 C
12 C
13 C
12 C
13 C
12 C
13 C
12 C
13 C
12 C
34 S
32 S
34 S
32 S
34 S
32 S
Fig. 5.10 Development of the relative intensities of the A+1 isotope signals of carbon (
13
C) and A+2
signals of sulphur (
34
S) by increasing atom numbers
5.1 Identification
109