

13 Some Frontier Technologies for Aptamers in Medical Applications
385
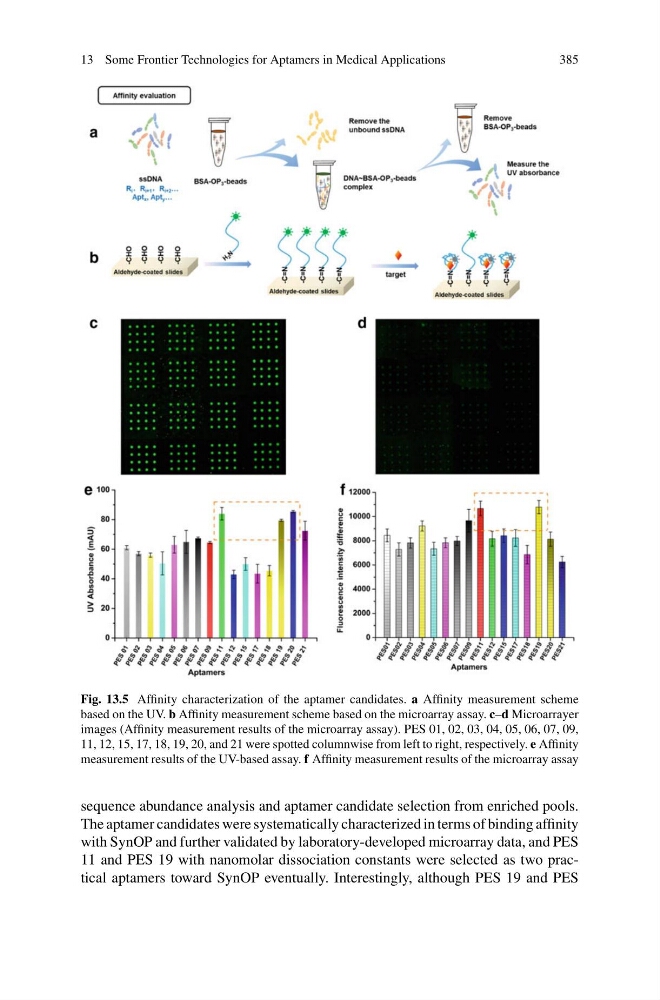
Fig. 13.5 Affinity characterization of the aptamer candidates. a Affinity measurement scheme
based on the UV. b Affinity measurement scheme based on the microarray assay. c–d Microarrayer
images (Affinity measurement results of the microarray assay). PES 01, 02, 03, 04, 05, 06, 07, 09,
11, 12, 15, 17, 18, 19, 20, and 21 were spotted columnwise from left to right, respectively. e Affinity
measurement results of the UV-based assay. f Affinity measurement results of the microarray assay
sequence abundance analysis and aptamer candidate selection from enriched pools.
The aptamer candidates were systematically characterized in terms of binding affinity
with SynOP and further validated by laboratory-developed microarray data, and PES
11 and PES 19 with nanomolar dissociation constants were selected as two practical aptamers toward SynOP eventually. Interestingly, although PES 19 and PES
385
Fig. 13.5 Affinity characterization of the aptamer candidates. a Affinity measurement scheme
based on the UV. b Affinity measurement scheme based on the microarray assay. c–d Microarrayer
images (Affinity measurement results of the microarray assay). PES 01, 02, 03, 04, 05, 06, 07, 09,
11, 12, 15, 17, 18, 19, 20, and 21 were spotted columnwise from left to right, respectively. e Affinity
measurement results of the UV-based assay. f Affinity measurement results of the microarray assay
sequence abundance analysis and aptamer candidate selection from enriched pools.
The aptamer candidates were systematically characterized in terms of binding affinity
with SynOP and further validated by laboratory-developed microarray data, and PES
11 and PES 19 with nanomolar dissociation constants were selected as two practical aptamers toward SynOP eventually. Interestingly, although PES 19 and PES