

62
K. Deng et al.
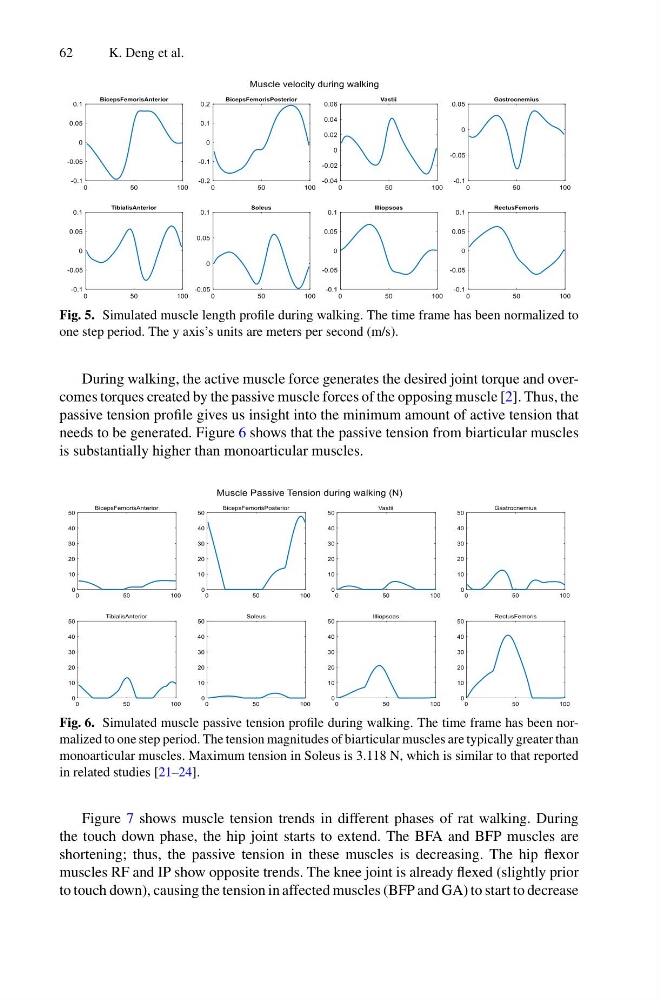
Fig. 5. Simulated muscle length profile during walking. The time frame has been normalized to
one step period. The y axis’s units are meters per second (m/s).
During walking, the active muscle force generates the desired joint torque and overcomes torques created by the passive muscle forces of the opposing muscle [2]. Thus, the
passive tension profile gives us insight into the minimum amount of active tension that
needs to be generated. Figure 6 shows that the passive tension from biarticular muscles
is substantially higher than monoarticular muscles.
Fig. 6. Simulated muscle passive tension profile during walking. The time frame has been normalized to one step period. The tension magnitudes of biarticular muscles are typically greater than
monoarticular muscles. Maximum tension in Soleus is 3.118 N, which is similar to that reported
in related studies [21–24].
Figure 7 shows muscle tension trends in different phases of rat walking. During
the touch down phase, the hip joint starts to extend. The BFA and BFP muscles are
shortening; thus, the passive tension in these muscles is decreasing. The hip flexor
muscles RF and IP show opposite trends. The knee joint is already flexed (slightly prior
to touch down), causing the tension in affected muscles (BFP and GA) to start to decrease
K. Deng et al.
Fig. 5. Simulated muscle length profile during walking. The time frame has been normalized to
one step period. The y axis’s units are meters per second (m/s).
During walking, the active muscle force generates the desired joint torque and overcomes torques created by the passive muscle forces of the opposing muscle [2]. Thus, the
passive tension profile gives us insight into the minimum amount of active tension that
needs to be generated. Figure 6 shows that the passive tension from biarticular muscles
is substantially higher than monoarticular muscles.
Fig. 6. Simulated muscle passive tension profile during walking. The time frame has been normalized to one step period. The tension magnitudes of biarticular muscles are typically greater than
monoarticular muscles. Maximum tension in Soleus is 3.118 N, which is similar to that reported
in related studies [21–24].
Figure 7 shows muscle tension trends in different phases of rat walking. During
the touch down phase, the hip joint starts to extend. The BFA and BFP muscles are
shortening; thus, the passive tension in these muscles is decreasing. The hip flexor
muscles RF and IP show opposite trends. The knee joint is already flexed (slightly prior
to touch down), causing the tension in affected muscles (BFP and GA) to start to decrease