

Kinematic and Kinetic Analysis of a Biomechanical Model
61
3.2 Muscle Profile During Walking
Since the muscle attachment points (origin, via waypoints, and insertion) are fixed on the
limb segment, their motion can be calculated based on the motion of each limb segment.
In this way, we calculated muscle length and velocity during leg movements.
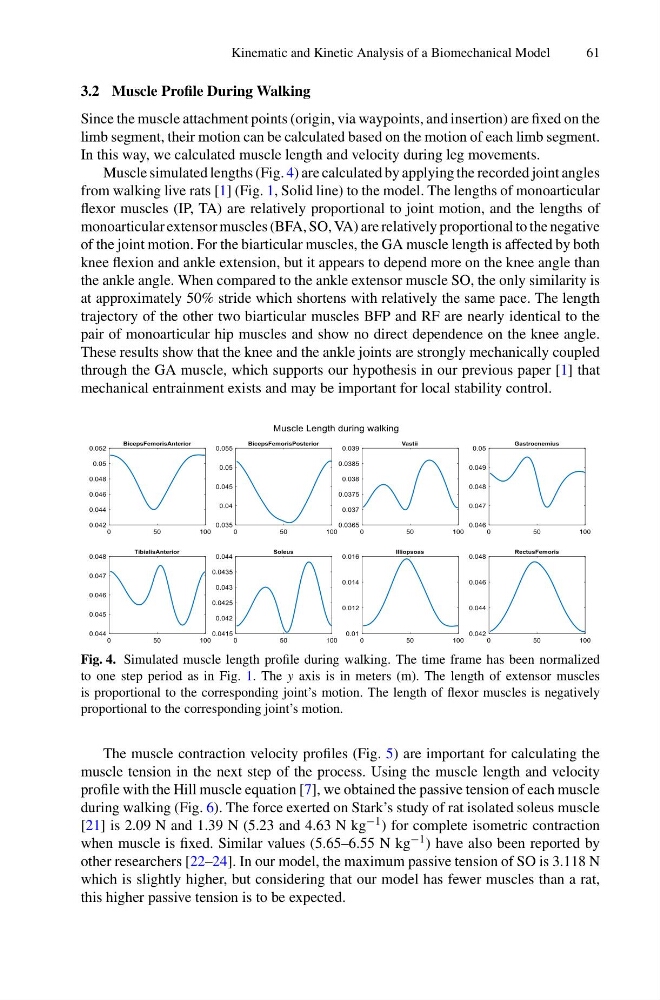
Muscle simulated lengths (Fig. 4) are calculated by applying the recorded joint angles
from walking live rats [1] (Fig. 1, Solid line) to the model. The lengths of monoarticular
flexor muscles (IP, TA) are relatively proportional to joint motion, and the lengths of
monoarticular extensor muscles (BFA, SO, VA) are relatively proportional to the negative
of the joint motion. For the biarticular muscles, the GA muscle length is affected by both
knee flexion and ankle extension, but it appears to depend more on the knee angle than
the ankle angle. When compared to the ankle extensor muscle SO, the only similarity is
at approximately 50% stride which shortens with relatively the same pace. The length
trajectory of the other two biarticular muscles BFP and RF are nearly identical to the
pair of monoarticular hip muscles and show no direct dependence on the knee angle.
These results show that the knee and the ankle joints are strongly mechanically coupled
through the GA muscle, which supports our hypothesis in our previous paper [1] that
mechanical entrainment exists and may be important for local stability control.
Fig. 4. Simulated muscle length profile during walking. The time frame has been normalized
to one step period as in Fig. 1. The y axis is in meters (m). The length of extensor muscles
is proportional to the corresponding joint’s motion. The length of flexor muscles is negatively
proportional to the corresponding joint’s motion.
The muscle contraction velocity profiles (Fig. 5) are important for calculating the
muscle tension in the next step of the process. Using the muscle length and velocity
profile with the Hill muscle equation [7], we obtained the passive tension of each muscle
during walking (Fig. 6). The force exerted on Stark’s study of rat isolated soleus muscle
[21] is 2.09 N and 1.39 N (5.23 and 4.63 N kg −1 ) for complete isometric contraction
when muscle is fixed. Similar values (5.65–6.55 N kg −1 ) have also been reported by
other researchers [22–24]. In our model, the maximum passive tension of SO is 3.118 N
which is slightly higher, but considering that our model has fewer muscles than a rat,
this higher passive tension is to be expected.
61
3.2 Muscle Profile During Walking
Since the muscle attachment points (origin, via waypoints, and insertion) are fixed on the
limb segment, their motion can be calculated based on the motion of each limb segment.
In this way, we calculated muscle length and velocity during leg movements.
Muscle simulated lengths (Fig. 4) are calculated by applying the recorded joint angles
from walking live rats [1] (Fig. 1, Solid line) to the model. The lengths of monoarticular
flexor muscles (IP, TA) are relatively proportional to joint motion, and the lengths of
monoarticular extensor muscles (BFA, SO, VA) are relatively proportional to the negative
of the joint motion. For the biarticular muscles, the GA muscle length is affected by both
knee flexion and ankle extension, but it appears to depend more on the knee angle than
the ankle angle. When compared to the ankle extensor muscle SO, the only similarity is
at approximately 50% stride which shortens with relatively the same pace. The length
trajectory of the other two biarticular muscles BFP and RF are nearly identical to the
pair of monoarticular hip muscles and show no direct dependence on the knee angle.
These results show that the knee and the ankle joints are strongly mechanically coupled
through the GA muscle, which supports our hypothesis in our previous paper [1] that
mechanical entrainment exists and may be important for local stability control.
Fig. 4. Simulated muscle length profile during walking. The time frame has been normalized
to one step period as in Fig. 1. The y axis is in meters (m). The length of extensor muscles
is proportional to the corresponding joint’s motion. The length of flexor muscles is negatively
proportional to the corresponding joint’s motion.
The muscle contraction velocity profiles (Fig. 5) are important for calculating the
muscle tension in the next step of the process. Using the muscle length and velocity
profile with the Hill muscle equation [7], we obtained the passive tension of each muscle
during walking (Fig. 6). The force exerted on Stark’s study of rat isolated soleus muscle
[21] is 2.09 N and 1.39 N (5.23 and 4.63 N kg −1 ) for complete isometric contraction
when muscle is fixed. Similar values (5.65–6.55 N kg −1 ) have also been reported by
other researchers [22–24]. In our model, the maximum passive tension of SO is 3.118 N
which is slightly higher, but considering that our model has fewer muscles than a rat,
this higher passive tension is to be expected.