

Optimization of Artificial Muscle Placements
265
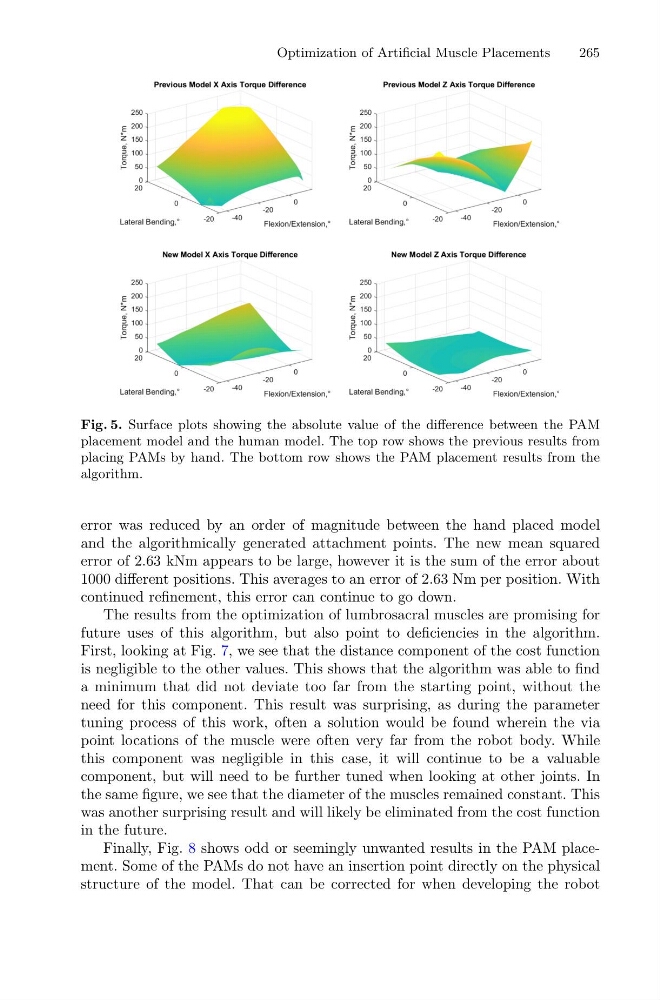
Fig. 5. Surface plots showing the absolute value of the difference between the PAM
placement model and the human model. The top row shows the previous results from
placing PAMs by hand. The bottom row shows the PAM placement results from the
algorithm.
error was reduced by an order of magnitude between the hand placed model
and the algorithmically generated attachment points. The new mean squared
error of 2.63 kNm appears to be large, however it is the sum of the error about
1000 different positions. This averages to an error of 2.63 Nm per position. With
continued refinement, this error can continue to go down.
The results from the optimization of lumbrosacral muscles are promising for
future uses of this algorithm, but also point to deficiencies in the algorithm.
First, looking at Fig. 7, we see that the distance component of the cost function
is negligible to the other values. This shows that the algorithm was able to find
a minimum that did not deviate too far from the starting point, without the
need for this component. This result was surprising, as during the parameter
tuning process of this work, often a solution would be found wherein the via
point locations of the muscle were often very far from the robot body. While
this component was negligible in this case, it will continue to be a valuable
component, but will need to be further tuned when looking at other joints. In
the same figure, we see that the diameter of the muscles remained constant. This
was another surprising result and will likely be eliminated from the cost function
in the future.
Finally, Fig. 8 shows odd or seemingly unwanted results in the PAM placement. Some of the PAMs do not have an insertion point directly on the physical
structure of the model. That can be corrected for when developing the robot
265
Fig. 5. Surface plots showing the absolute value of the difference between the PAM
placement model and the human model. The top row shows the previous results from
placing PAMs by hand. The bottom row shows the PAM placement results from the
algorithm.
error was reduced by an order of magnitude between the hand placed model
and the algorithmically generated attachment points. The new mean squared
error of 2.63 kNm appears to be large, however it is the sum of the error about
1000 different positions. This averages to an error of 2.63 Nm per position. With
continued refinement, this error can continue to go down.
The results from the optimization of lumbrosacral muscles are promising for
future uses of this algorithm, but also point to deficiencies in the algorithm.
First, looking at Fig. 7, we see that the distance component of the cost function
is negligible to the other values. This shows that the algorithm was able to find
a minimum that did not deviate too far from the starting point, without the
need for this component. This result was surprising, as during the parameter
tuning process of this work, often a solution would be found wherein the via
point locations of the muscle were often very far from the robot body. While
this component was negligible in this case, it will continue to be a valuable
component, but will need to be further tuned when looking at other joints. In
the same figure, we see that the diameter of the muscles remained constant. This
was another surprising result and will likely be eliminated from the cost function
in the future.
Finally, Fig. 8 shows odd or seemingly unwanted results in the PAM placement. Some of the PAMs do not have an insertion point directly on the physical
structure of the model. That can be corrected for when developing the robot